Osage vs Immigrants from Nicaragua Median Household Income
COMPARE
Osage
Immigrants from Nicaragua
Median Household Income
Median Household Income Comparison
Osage
Immigrants from Nicaragua
$75,240
MEDIAN HOUSEHOLD INCOME
0.2/ 100
METRIC RATING
278th/ 347
METRIC RANK
$76,784
MEDIAN HOUSEHOLD INCOME
0.5/ 100
METRIC RATING
258th/ 347
METRIC RANK
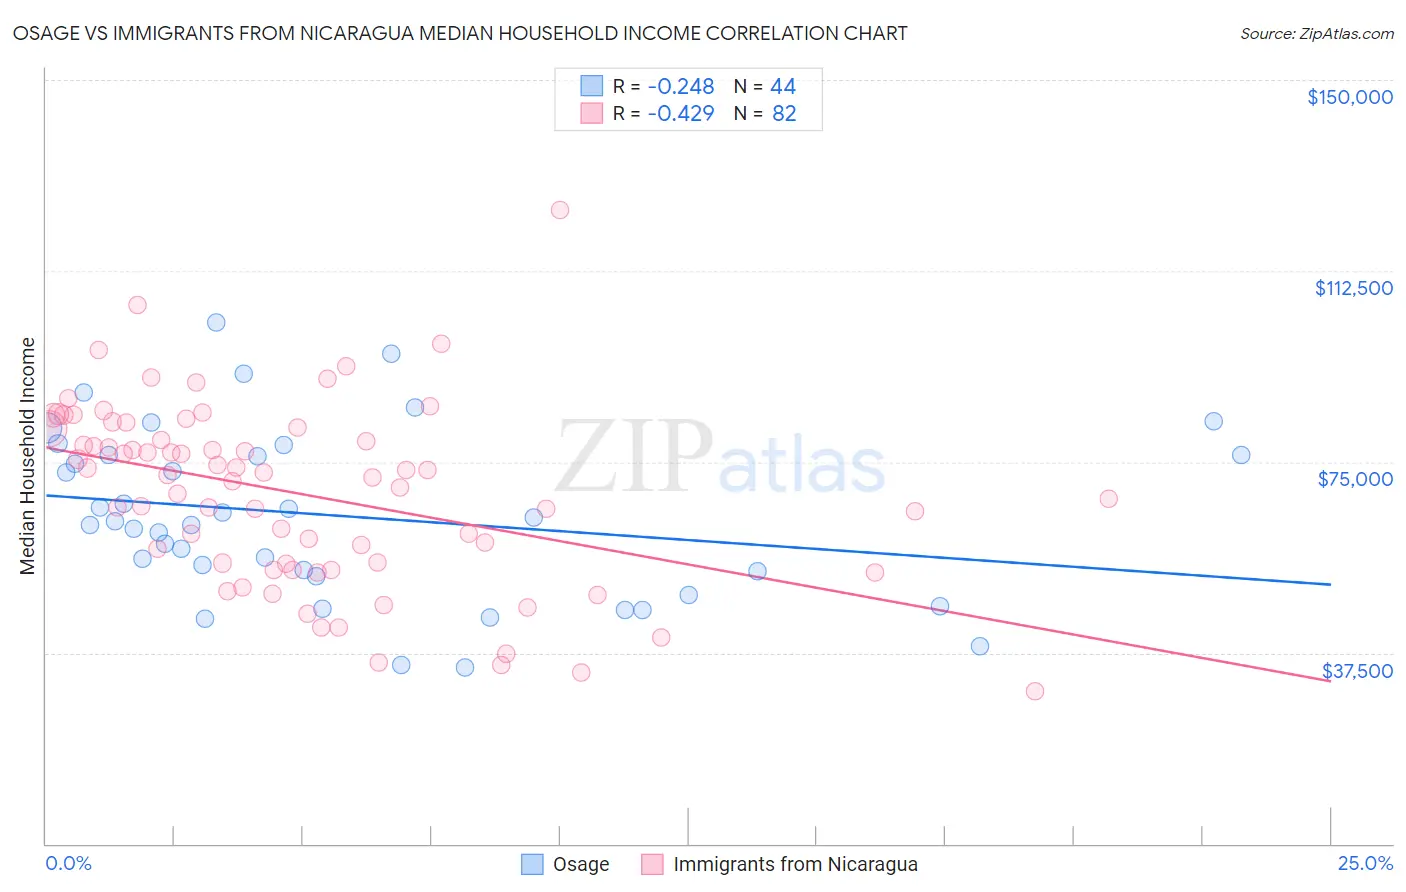
Osage vs Immigrants from Nicaragua Median Household Income Correlation Chart
The statistical analysis conducted on geographies consisting of 91,796,475 people shows a weak negative correlation between the proportion of Osage and median household income in the United States with a correlation coefficient (R) of -0.248 and weighted average of $75,240. Similarly, the statistical analysis conducted on geographies consisting of 236,313,434 people shows a moderate negative correlation between the proportion of Immigrants from Nicaragua and median household income in the United States with a correlation coefficient (R) of -0.429 and weighted average of $76,784, a difference of 2.1%.
Median Household Income Correlation Summary
| Measurement | Osage | Immigrants from Nicaragua |
| Minimum | $34,735 | $29,878 |
| Maximum | $102,379 | $124,491 |
| Range | $67,644 | $94,613 |
| Mean | $64,368 | $68,743 |
| Median | $62,912 | $72,189 |
| Interquartile 25% (IQ1) | $52,984 | $54,917 |
| Interquartile 75% (IQ3) | $76,272 | $81,583 |
| Interquartile Range (IQR) | $23,288 | $26,666 |
| Standard Deviation (Sample) | $16,574 | $17,913 |
| Standard Deviation (Population) | $16,385 | $17,803 |
Demographics Similar to Osage and Immigrants from Nicaragua by Median Household Income
In terms of median household income, the demographic groups most similar to Osage are Spanish American ($75,386, a difference of 0.19%), Immigrants from Latin America ($75,420, a difference of 0.24%), Immigrants from Micronesia ($75,574, a difference of 0.44%), British West Indian ($75,647, a difference of 0.54%), and Liberian ($75,667, a difference of 0.57%). Similarly, the demographic groups most similar to Immigrants from Nicaragua are Spanish American Indian ($76,670, a difference of 0.15%), Jamaican ($76,583, a difference of 0.26%), Immigrants from Grenada ($76,517, a difference of 0.35%), French American Indian ($76,387, a difference of 0.52%), and Alaskan Athabascan ($76,383, a difference of 0.52%).
| Demographics | Rating | Rank | Median Household Income |
| Immigrants | Nicaragua | 0.5 /100 | #258 | Tragic $76,784 |
| Spanish American Indians | 0.4 /100 | #259 | Tragic $76,670 |
| Jamaicans | 0.4 /100 | #260 | Tragic $76,583 |
| Immigrants | Grenada | 0.4 /100 | #261 | Tragic $76,517 |
| French American Indians | 0.4 /100 | #262 | Tragic $76,387 |
| Alaskan Athabascans | 0.4 /100 | #263 | Tragic $76,383 |
| Guatemalans | 0.3 /100 | #264 | Tragic $75,961 |
| Immigrants | Belize | 0.3 /100 | #265 | Tragic $75,938 |
| Americans | 0.3 /100 | #266 | Tragic $75,932 |
| German Russians | 0.3 /100 | #267 | Tragic $75,856 |
| Immigrants | Jamaica | 0.3 /100 | #268 | Tragic $75,851 |
| Cape Verdeans | 0.3 /100 | #269 | Tragic $75,848 |
| Hmong | 0.3 /100 | #270 | Tragic $75,839 |
| Pennsylvania Germans | 0.3 /100 | #271 | Tragic $75,814 |
| Somalis | 0.3 /100 | #272 | Tragic $75,782 |
| Liberians | 0.2 /100 | #273 | Tragic $75,667 |
| British West Indians | 0.2 /100 | #274 | Tragic $75,647 |
| Immigrants | Micronesia | 0.2 /100 | #275 | Tragic $75,574 |
| Immigrants | Latin America | 0.2 /100 | #276 | Tragic $75,420 |
| Spanish Americans | 0.2 /100 | #277 | Tragic $75,386 |
| Osage | 0.2 /100 | #278 | Tragic $75,240 |