Polish vs Immigrants from Indonesia Per Capita Income
COMPARE
Polish
Immigrants from Indonesia
Per Capita Income
Per Capita Income Comparison
Poles
Immigrants from Indonesia
$46,123
PER CAPITA INCOME
94.1/ 100
METRIC RATING
116th/ 347
METRIC RANK
$48,195
PER CAPITA INCOME
99.4/ 100
METRIC RATING
82nd/ 347
METRIC RANK
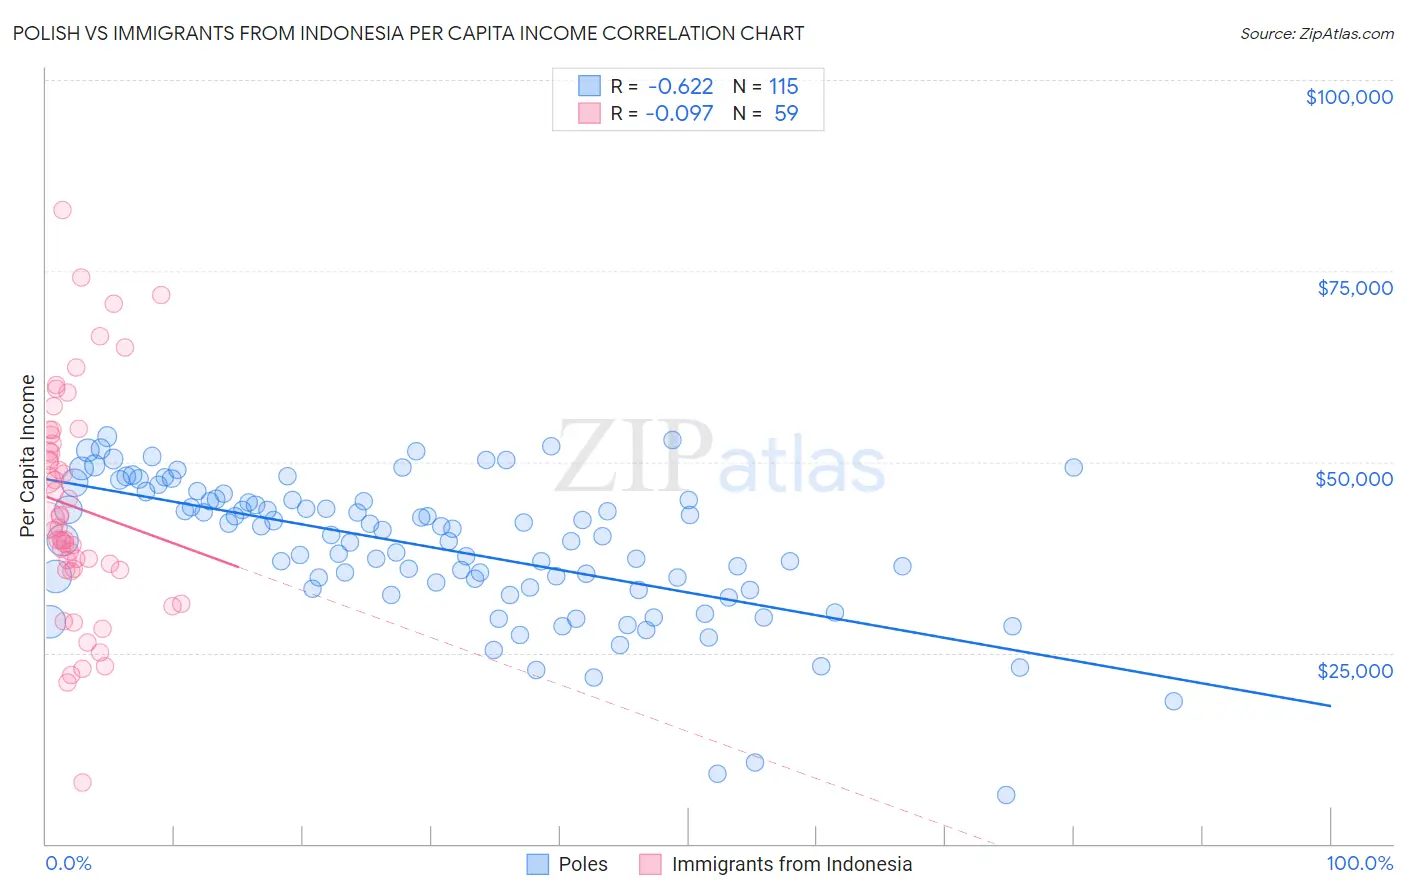
Polish vs Immigrants from Indonesia Per Capita Income Correlation Chart
The statistical analysis conducted on geographies consisting of 560,657,396 people shows a significant negative correlation between the proportion of Poles and per capita income in the United States with a correlation coefficient (R) of -0.622 and weighted average of $46,123. Similarly, the statistical analysis conducted on geographies consisting of 215,786,434 people shows a slight negative correlation between the proportion of Immigrants from Indonesia and per capita income in the United States with a correlation coefficient (R) of -0.097 and weighted average of $48,195, a difference of 4.5%.
Per Capita Income Correlation Summary
| Measurement | Polish | Immigrants from Indonesia |
| Minimum | $6,461 | $8,026 |
| Maximum | $53,317 | $82,949 |
| Range | $46,856 | $74,923 |
| Mean | $38,750 | $44,054 |
| Median | $40,450 | $41,336 |
| Interquartile 25% (IQ1) | $33,437 | $35,904 |
| Interquartile 75% (IQ3) | $44,990 | $53,591 |
| Interquartile Range (IQR) | $11,553 | $17,688 |
| Standard Deviation (Sample) | $9,315 | $14,587 |
| Standard Deviation (Population) | $9,274 | $14,462 |
Similar Demographics by Per Capita Income
Demographics Similar to Poles by Per Capita Income
In terms of per capita income, the demographic groups most similar to Poles are Chinese ($46,098, a difference of 0.050%), Immigrants from Chile ($46,213, a difference of 0.20%), Immigrants from Saudi Arabia ($46,008, a difference of 0.25%), Immigrants from Poland ($45,979, a difference of 0.31%), and Afghan ($46,268, a difference of 0.32%).
| Demographics | Rating | Rank | Per Capita Income |
| Immigrants | Northern Africa | 96.2 /100 | #109 | Exceptional $46,531 |
| Chileans | 95.9 /100 | #110 | Exceptional $46,459 |
| Taiwanese | 95.8 /100 | #111 | Exceptional $46,455 |
| Immigrants | Morocco | 95.7 /100 | #112 | Exceptional $46,430 |
| Immigrants | Albania | 95.5 /100 | #113 | Exceptional $46,387 |
| Afghans | 94.9 /100 | #114 | Exceptional $46,268 |
| Immigrants | Chile | 94.6 /100 | #115 | Exceptional $46,213 |
| Poles | 94.1 /100 | #116 | Exceptional $46,123 |
| Chinese | 93.9 /100 | #117 | Exceptional $46,098 |
| Immigrants | Saudi Arabia | 93.3 /100 | #118 | Exceptional $46,008 |
| Immigrants | Poland | 93.1 /100 | #119 | Exceptional $45,979 |
| Immigrants | Ethiopia | 92.7 /100 | #120 | Exceptional $45,923 |
| Canadians | 92.2 /100 | #121 | Exceptional $45,858 |
| Moroccans | 92.1 /100 | #122 | Exceptional $45,854 |
| Lebanese | 92.0 /100 | #123 | Exceptional $45,840 |
Demographics Similar to Immigrants from Indonesia by Per Capita Income
In terms of per capita income, the demographic groups most similar to Immigrants from Indonesia are Immigrants from Brazil ($48,164, a difference of 0.060%), Immigrants from Ukraine ($48,134, a difference of 0.13%), Austrian ($48,116, a difference of 0.16%), Armenian ($48,287, a difference of 0.19%), and Egyptian ($48,358, a difference of 0.34%).
| Demographics | Rating | Rank | Per Capita Income |
| Immigrants | Bolivia | 99.7 /100 | #75 | Exceptional $48,970 |
| Immigrants | England | 99.7 /100 | #76 | Exceptional $48,844 |
| Immigrants | Kazakhstan | 99.7 /100 | #77 | Exceptional $48,747 |
| Immigrants | Italy | 99.6 /100 | #78 | Exceptional $48,654 |
| Romanians | 99.5 /100 | #79 | Exceptional $48,445 |
| Egyptians | 99.5 /100 | #80 | Exceptional $48,358 |
| Armenians | 99.4 /100 | #81 | Exceptional $48,287 |
| Immigrants | Indonesia | 99.4 /100 | #82 | Exceptional $48,195 |
| Immigrants | Brazil | 99.4 /100 | #83 | Exceptional $48,164 |
| Immigrants | Ukraine | 99.3 /100 | #84 | Exceptional $48,134 |
| Austrians | 99.3 /100 | #85 | Exceptional $48,116 |
| Immigrants | Southern Europe | 99.3 /100 | #86 | Exceptional $48,027 |
| Ukrainians | 99.3 /100 | #87 | Exceptional $48,014 |
| Croatians | 99.0 /100 | #88 | Exceptional $47,742 |
| Northern Europeans | 98.9 /100 | #89 | Exceptional $47,698 |