Immigrants from Burma/Myanmar vs Immigrants from Indonesia Per Capita Income
COMPARE
Immigrants from Burma/Myanmar
Immigrants from Indonesia
Per Capita Income
Per Capita Income Comparison
Immigrants from Burma/Myanmar
Immigrants from Indonesia
$39,827
PER CAPITA INCOME
1.3/ 100
METRIC RATING
250th/ 347
METRIC RANK
$48,195
PER CAPITA INCOME
99.4/ 100
METRIC RATING
82nd/ 347
METRIC RANK
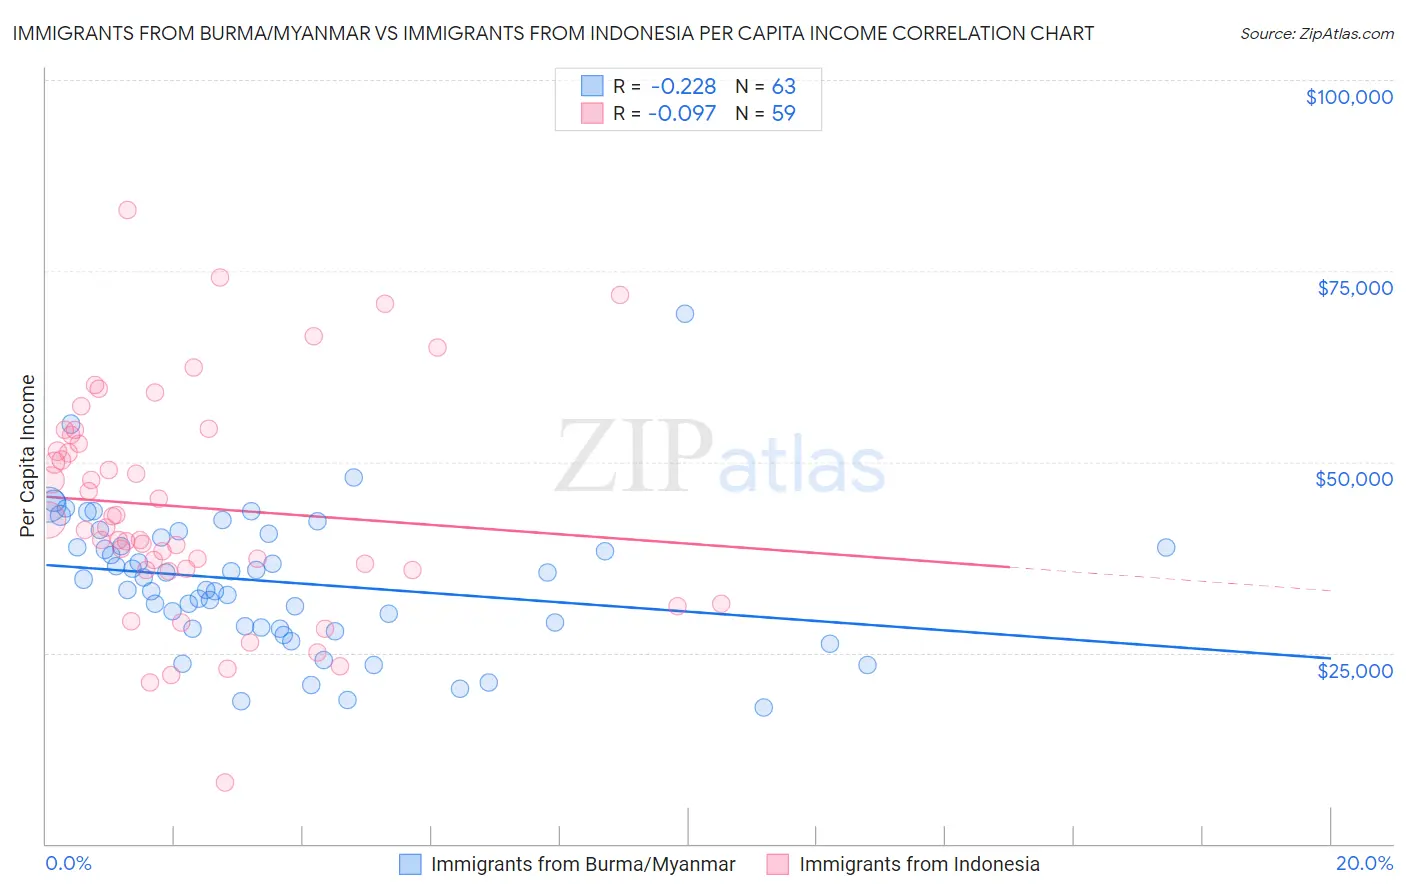
Immigrants from Burma/Myanmar vs Immigrants from Indonesia Per Capita Income Correlation Chart
The statistical analysis conducted on geographies consisting of 172,363,704 people shows a weak negative correlation between the proportion of Immigrants from Burma/Myanmar and per capita income in the United States with a correlation coefficient (R) of -0.228 and weighted average of $39,827. Similarly, the statistical analysis conducted on geographies consisting of 215,786,434 people shows a slight negative correlation between the proportion of Immigrants from Indonesia and per capita income in the United States with a correlation coefficient (R) of -0.097 and weighted average of $48,195, a difference of 21.0%.
Per Capita Income Correlation Summary
| Measurement | Immigrants from Burma/Myanmar | Immigrants from Indonesia |
| Minimum | $17,897 | $8,026 |
| Maximum | $69,358 | $82,949 |
| Range | $51,461 | $74,923 |
| Mean | $34,299 | $44,054 |
| Median | $34,636 | $41,336 |
| Interquartile 25% (IQ1) | $28,210 | $35,904 |
| Interquartile 75% (IQ3) | $40,057 | $53,591 |
| Interquartile Range (IQR) | $11,847 | $17,688 |
| Standard Deviation (Sample) | $9,103 | $14,587 |
| Standard Deviation (Population) | $9,031 | $14,462 |
Similar Demographics by Per Capita Income
Demographics Similar to Immigrants from Burma/Myanmar by Per Capita Income
In terms of per capita income, the demographic groups most similar to Immigrants from Burma/Myanmar are Samoan ($39,826, a difference of 0.0%), Japanese ($39,870, a difference of 0.11%), Cape Verdean ($39,935, a difference of 0.27%), Immigrants from Somalia ($39,974, a difference of 0.37%), and Immigrants from the Azores ($39,608, a difference of 0.55%).
| Demographics | Rating | Rank | Per Capita Income |
| German Russians | 2.2 /100 | #243 | Tragic $40,266 |
| French American Indians | 2.1 /100 | #244 | Tragic $40,244 |
| Sub-Saharan Africans | 1.9 /100 | #245 | Tragic $40,152 |
| Cree | 1.7 /100 | #246 | Tragic $40,056 |
| Immigrants | Somalia | 1.6 /100 | #247 | Tragic $39,974 |
| Cape Verdeans | 1.5 /100 | #248 | Tragic $39,935 |
| Japanese | 1.4 /100 | #249 | Tragic $39,870 |
| Immigrants | Burma/Myanmar | 1.3 /100 | #250 | Tragic $39,827 |
| Samoans | 1.3 /100 | #251 | Tragic $39,826 |
| Immigrants | Azores | 1.0 /100 | #252 | Tragic $39,608 |
| Osage | 1.0 /100 | #253 | Tragic $39,568 |
| Alaska Natives | 1.0 /100 | #254 | Tragic $39,558 |
| Immigrants | Middle Africa | 1.0 /100 | #255 | Tragic $39,529 |
| Hawaiians | 0.8 /100 | #256 | Tragic $39,403 |
| Nicaraguans | 0.8 /100 | #257 | Tragic $39,372 |
Demographics Similar to Immigrants from Indonesia by Per Capita Income
In terms of per capita income, the demographic groups most similar to Immigrants from Indonesia are Immigrants from Brazil ($48,164, a difference of 0.060%), Immigrants from Ukraine ($48,134, a difference of 0.13%), Austrian ($48,116, a difference of 0.16%), Armenian ($48,287, a difference of 0.19%), and Egyptian ($48,358, a difference of 0.34%).
| Demographics | Rating | Rank | Per Capita Income |
| Immigrants | Bolivia | 99.7 /100 | #75 | Exceptional $48,970 |
| Immigrants | England | 99.7 /100 | #76 | Exceptional $48,844 |
| Immigrants | Kazakhstan | 99.7 /100 | #77 | Exceptional $48,747 |
| Immigrants | Italy | 99.6 /100 | #78 | Exceptional $48,654 |
| Romanians | 99.5 /100 | #79 | Exceptional $48,445 |
| Egyptians | 99.5 /100 | #80 | Exceptional $48,358 |
| Armenians | 99.4 /100 | #81 | Exceptional $48,287 |
| Immigrants | Indonesia | 99.4 /100 | #82 | Exceptional $48,195 |
| Immigrants | Brazil | 99.4 /100 | #83 | Exceptional $48,164 |
| Immigrants | Ukraine | 99.3 /100 | #84 | Exceptional $48,134 |
| Austrians | 99.3 /100 | #85 | Exceptional $48,116 |
| Immigrants | Southern Europe | 99.3 /100 | #86 | Exceptional $48,027 |
| Ukrainians | 99.3 /100 | #87 | Exceptional $48,014 |
| Croatians | 99.0 /100 | #88 | Exceptional $47,742 |
| Northern Europeans | 98.9 /100 | #89 | Exceptional $47,698 |