Samoan vs Immigrants from Indonesia Per Capita Income
COMPARE
Samoan
Immigrants from Indonesia
Per Capita Income
Per Capita Income Comparison
Samoans
Immigrants from Indonesia
$39,826
PER CAPITA INCOME
1.3/ 100
METRIC RATING
251st/ 347
METRIC RANK
$48,195
PER CAPITA INCOME
99.4/ 100
METRIC RATING
82nd/ 347
METRIC RANK
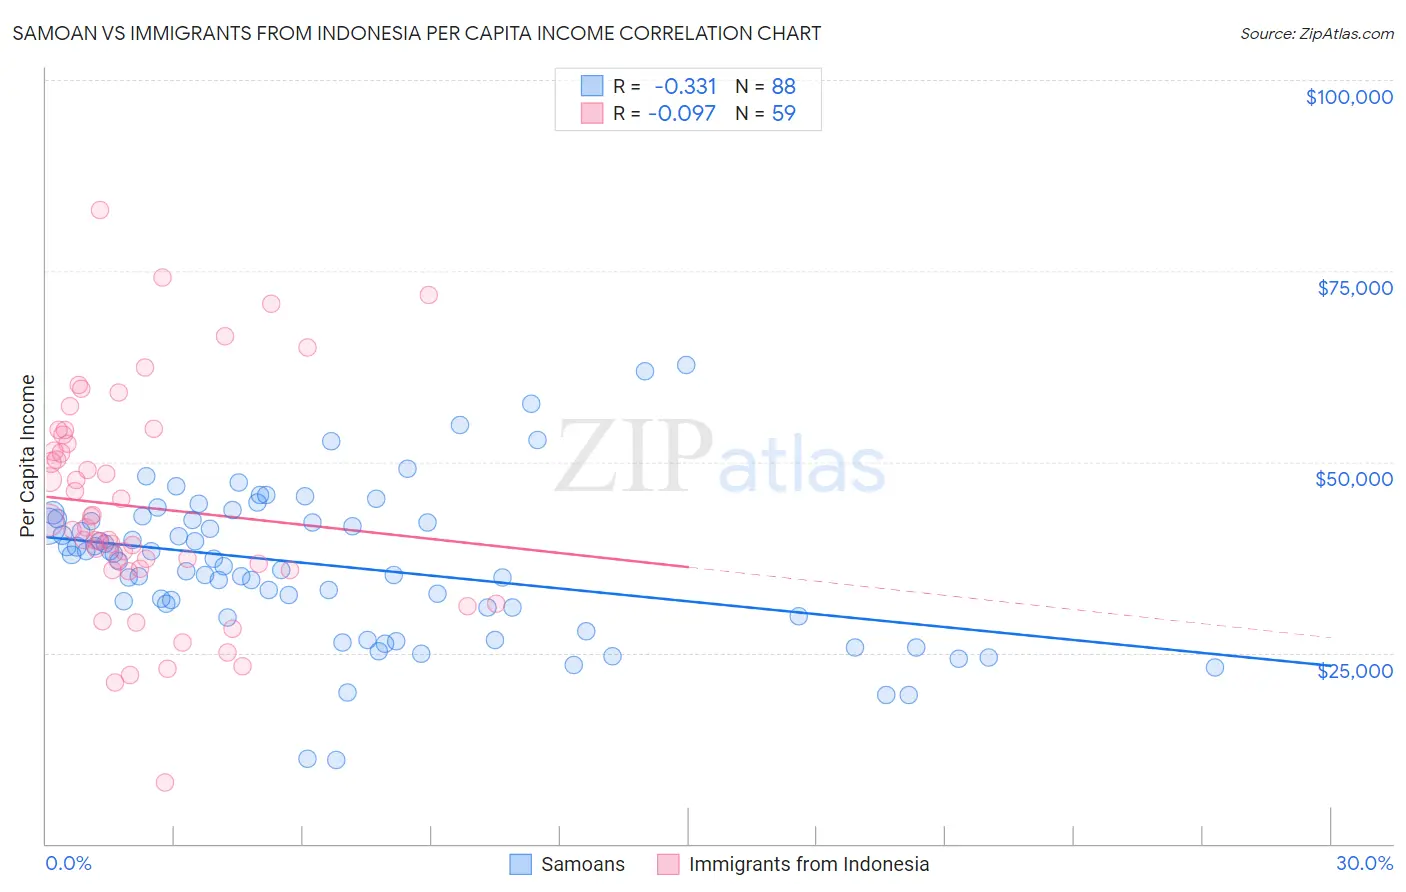
Samoan vs Immigrants from Indonesia Per Capita Income Correlation Chart
The statistical analysis conducted on geographies consisting of 225,205,450 people shows a mild negative correlation between the proportion of Samoans and per capita income in the United States with a correlation coefficient (R) of -0.331 and weighted average of $39,826. Similarly, the statistical analysis conducted on geographies consisting of 215,786,434 people shows a slight negative correlation between the proportion of Immigrants from Indonesia and per capita income in the United States with a correlation coefficient (R) of -0.097 and weighted average of $48,195, a difference of 21.0%.
Per Capita Income Correlation Summary
| Measurement | Samoan | Immigrants from Indonesia |
| Minimum | $10,974 | $8,026 |
| Maximum | $62,755 | $82,949 |
| Range | $51,781 | $74,923 |
| Mean | $36,431 | $44,054 |
| Median | $37,144 | $41,336 |
| Interquartile 25% (IQ1) | $30,385 | $35,904 |
| Interquartile 75% (IQ3) | $42,312 | $53,591 |
| Interquartile Range (IQR) | $11,926 | $17,688 |
| Standard Deviation (Sample) | $9,882 | $14,587 |
| Standard Deviation (Population) | $9,825 | $14,462 |
Similar Demographics by Per Capita Income
Demographics Similar to Samoans by Per Capita Income
In terms of per capita income, the demographic groups most similar to Samoans are Immigrants from Burma/Myanmar ($39,827, a difference of 0.0%), Japanese ($39,870, a difference of 0.11%), Cape Verdean ($39,935, a difference of 0.27%), Immigrants from Somalia ($39,974, a difference of 0.37%), and Immigrants from the Azores ($39,608, a difference of 0.55%).
| Demographics | Rating | Rank | Per Capita Income |
| French American Indians | 2.1 /100 | #244 | Tragic $40,244 |
| Sub-Saharan Africans | 1.9 /100 | #245 | Tragic $40,152 |
| Cree | 1.7 /100 | #246 | Tragic $40,056 |
| Immigrants | Somalia | 1.6 /100 | #247 | Tragic $39,974 |
| Cape Verdeans | 1.5 /100 | #248 | Tragic $39,935 |
| Japanese | 1.4 /100 | #249 | Tragic $39,870 |
| Immigrants | Burma/Myanmar | 1.3 /100 | #250 | Tragic $39,827 |
| Samoans | 1.3 /100 | #251 | Tragic $39,826 |
| Immigrants | Azores | 1.0 /100 | #252 | Tragic $39,608 |
| Osage | 1.0 /100 | #253 | Tragic $39,568 |
| Alaska Natives | 1.0 /100 | #254 | Tragic $39,558 |
| Immigrants | Middle Africa | 1.0 /100 | #255 | Tragic $39,529 |
| Hawaiians | 0.8 /100 | #256 | Tragic $39,403 |
| Nicaraguans | 0.8 /100 | #257 | Tragic $39,372 |
| Jamaicans | 0.7 /100 | #258 | Tragic $39,231 |
Demographics Similar to Immigrants from Indonesia by Per Capita Income
In terms of per capita income, the demographic groups most similar to Immigrants from Indonesia are Immigrants from Brazil ($48,164, a difference of 0.060%), Immigrants from Ukraine ($48,134, a difference of 0.13%), Austrian ($48,116, a difference of 0.16%), Armenian ($48,287, a difference of 0.19%), and Egyptian ($48,358, a difference of 0.34%).
| Demographics | Rating | Rank | Per Capita Income |
| Immigrants | Bolivia | 99.7 /100 | #75 | Exceptional $48,970 |
| Immigrants | England | 99.7 /100 | #76 | Exceptional $48,844 |
| Immigrants | Kazakhstan | 99.7 /100 | #77 | Exceptional $48,747 |
| Immigrants | Italy | 99.6 /100 | #78 | Exceptional $48,654 |
| Romanians | 99.5 /100 | #79 | Exceptional $48,445 |
| Egyptians | 99.5 /100 | #80 | Exceptional $48,358 |
| Armenians | 99.4 /100 | #81 | Exceptional $48,287 |
| Immigrants | Indonesia | 99.4 /100 | #82 | Exceptional $48,195 |
| Immigrants | Brazil | 99.4 /100 | #83 | Exceptional $48,164 |
| Immigrants | Ukraine | 99.3 /100 | #84 | Exceptional $48,134 |
| Austrians | 99.3 /100 | #85 | Exceptional $48,116 |
| Immigrants | Southern Europe | 99.3 /100 | #86 | Exceptional $48,027 |
| Ukrainians | 99.3 /100 | #87 | Exceptional $48,014 |
| Croatians | 99.0 /100 | #88 | Exceptional $47,742 |
| Northern Europeans | 98.9 /100 | #89 | Exceptional $47,698 |