Polish vs Nonimmigrants Per Capita Income
COMPARE
Polish
Nonimmigrants
Per Capita Income
Per Capita Income Comparison
Poles
Nonimmigrants
$46,123
PER CAPITA INCOME
94.1/ 100
METRIC RATING
116th/ 347
METRIC RANK
$40,669
PER CAPITA INCOME
3.4/ 100
METRIC RATING
236th/ 347
METRIC RANK
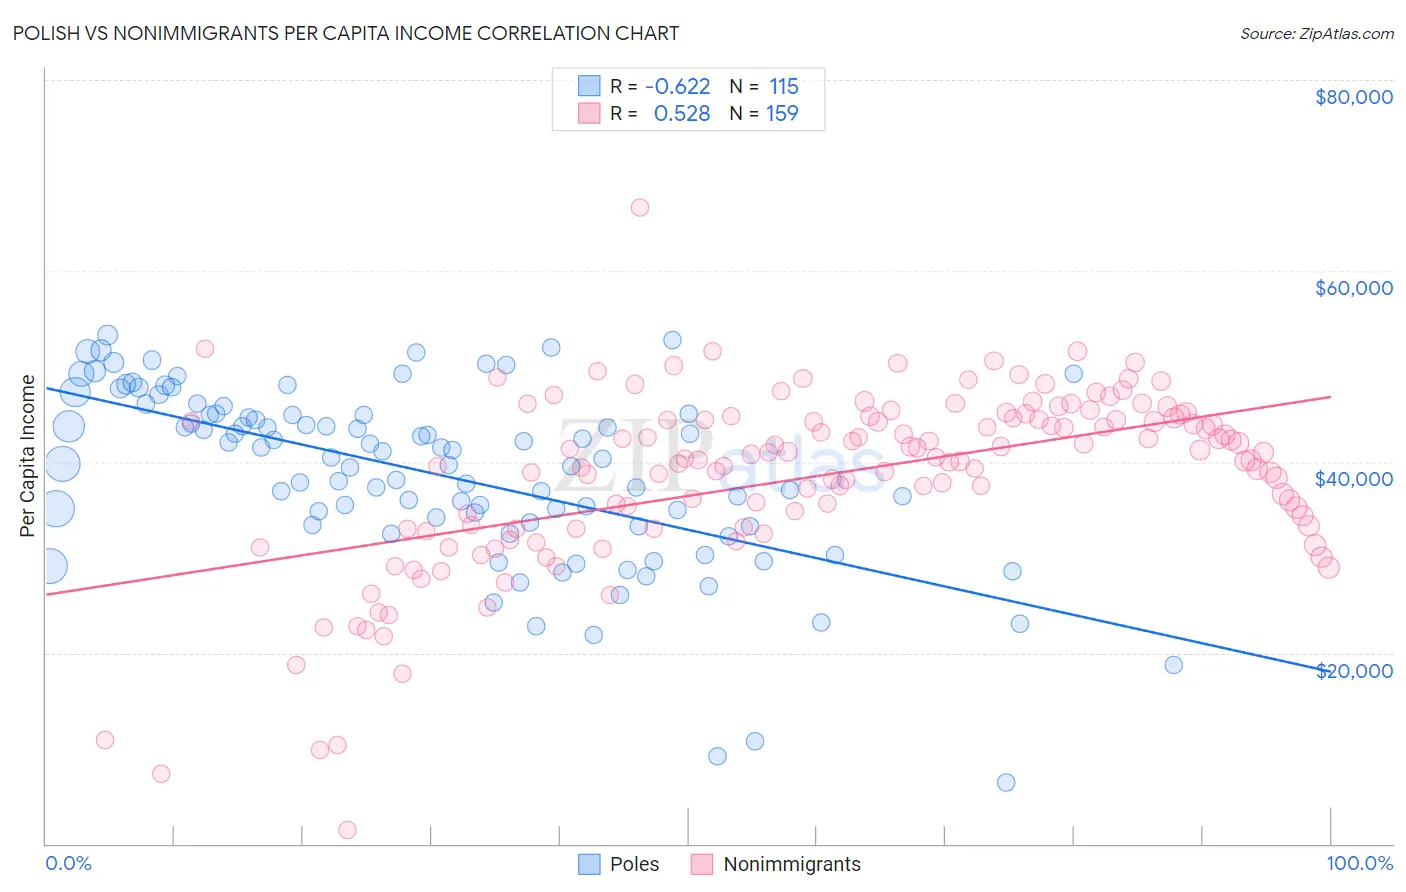
Polish vs Nonimmigrants Per Capita Income Correlation Chart
The statistical analysis conducted on geographies consisting of 560,657,396 people shows a significant negative correlation between the proportion of Poles and per capita income in the United States with a correlation coefficient (R) of -0.622 and weighted average of $46,123. Similarly, the statistical analysis conducted on geographies consisting of 585,383,873 people shows a substantial positive correlation between the proportion of Nonimmigrants and per capita income in the United States with a correlation coefficient (R) of 0.528 and weighted average of $40,669, a difference of 13.4%.
Per Capita Income Correlation Summary
| Measurement | Polish | Nonimmigrants |
| Minimum | $6,461 | $1,397 |
| Maximum | $53,317 | $66,659 |
| Range | $46,856 | $65,262 |
| Mean | $38,750 | $38,443 |
| Median | $40,450 | $40,388 |
| Interquartile 25% (IQ1) | $33,437 | $33,053 |
| Interquartile 75% (IQ3) | $44,990 | $44,574 |
| Interquartile Range (IQR) | $11,553 | $11,521 |
| Standard Deviation (Sample) | $9,315 | $9,433 |
| Standard Deviation (Population) | $9,274 | $9,403 |
Similar Demographics by Per Capita Income
Demographics Similar to Poles by Per Capita Income
In terms of per capita income, the demographic groups most similar to Poles are Chinese ($46,098, a difference of 0.050%), Immigrants from Chile ($46,213, a difference of 0.20%), Immigrants from Saudi Arabia ($46,008, a difference of 0.25%), Immigrants from Poland ($45,979, a difference of 0.31%), and Afghan ($46,268, a difference of 0.32%).
| Demographics | Rating | Rank | Per Capita Income |
| Immigrants | Northern Africa | 96.2 /100 | #109 | Exceptional $46,531 |
| Chileans | 95.9 /100 | #110 | Exceptional $46,459 |
| Taiwanese | 95.8 /100 | #111 | Exceptional $46,455 |
| Immigrants | Morocco | 95.7 /100 | #112 | Exceptional $46,430 |
| Immigrants | Albania | 95.5 /100 | #113 | Exceptional $46,387 |
| Afghans | 94.9 /100 | #114 | Exceptional $46,268 |
| Immigrants | Chile | 94.6 /100 | #115 | Exceptional $46,213 |
| Poles | 94.1 /100 | #116 | Exceptional $46,123 |
| Chinese | 93.9 /100 | #117 | Exceptional $46,098 |
| Immigrants | Saudi Arabia | 93.3 /100 | #118 | Exceptional $46,008 |
| Immigrants | Poland | 93.1 /100 | #119 | Exceptional $45,979 |
| Immigrants | Ethiopia | 92.7 /100 | #120 | Exceptional $45,923 |
| Canadians | 92.2 /100 | #121 | Exceptional $45,858 |
| Moroccans | 92.1 /100 | #122 | Exceptional $45,854 |
| Lebanese | 92.0 /100 | #123 | Exceptional $45,840 |
Demographics Similar to Nonimmigrants by Per Capita Income
In terms of per capita income, the demographic groups most similar to Nonimmigrants are Immigrants from Guyana ($40,742, a difference of 0.18%), Immigrants from West Indies ($40,763, a difference of 0.23%), Delaware ($40,778, a difference of 0.27%), Immigrants from Cambodia ($40,434, a difference of 0.58%), and Guyanese ($40,949, a difference of 0.69%).
| Demographics | Rating | Rank | Per Capita Income |
| Nigerians | 4.9 /100 | #229 | Tragic $41,026 |
| Native Hawaiians | 4.9 /100 | #230 | Tragic $41,017 |
| Senegalese | 4.8 /100 | #231 | Tragic $41,000 |
| Guyanese | 4.5 /100 | #232 | Tragic $40,949 |
| Delaware | 3.8 /100 | #233 | Tragic $40,778 |
| Immigrants | West Indies | 3.7 /100 | #234 | Tragic $40,763 |
| Immigrants | Guyana | 3.6 /100 | #235 | Tragic $40,742 |
| Immigrants | Nonimmigrants | 3.4 /100 | #236 | Tragic $40,669 |
| Immigrants | Cambodia | 2.6 /100 | #237 | Tragic $40,434 |
| Somalis | 2.4 /100 | #238 | Tragic $40,367 |
| Tsimshian | 2.4 /100 | #239 | Tragic $40,344 |
| Immigrants | Nigeria | 2.3 /100 | #240 | Tragic $40,339 |
| British West Indians | 2.3 /100 | #241 | Tragic $40,330 |
| Immigrants | Western Africa | 2.2 /100 | #242 | Tragic $40,294 |
| German Russians | 2.2 /100 | #243 | Tragic $40,266 |