Polish vs Immigrants from Indonesia Master's Degree
COMPARE
Polish
Immigrants from Indonesia
Master's Degree
Master's Degree Comparison
Poles
Immigrants from Indonesia
15.7%
MASTER'S DEGREE
85.0/ 100
METRIC RATING
141st/ 347
METRIC RANK
17.6%
MASTER'S DEGREE
99.6/ 100
METRIC RATING
76th/ 347
METRIC RANK
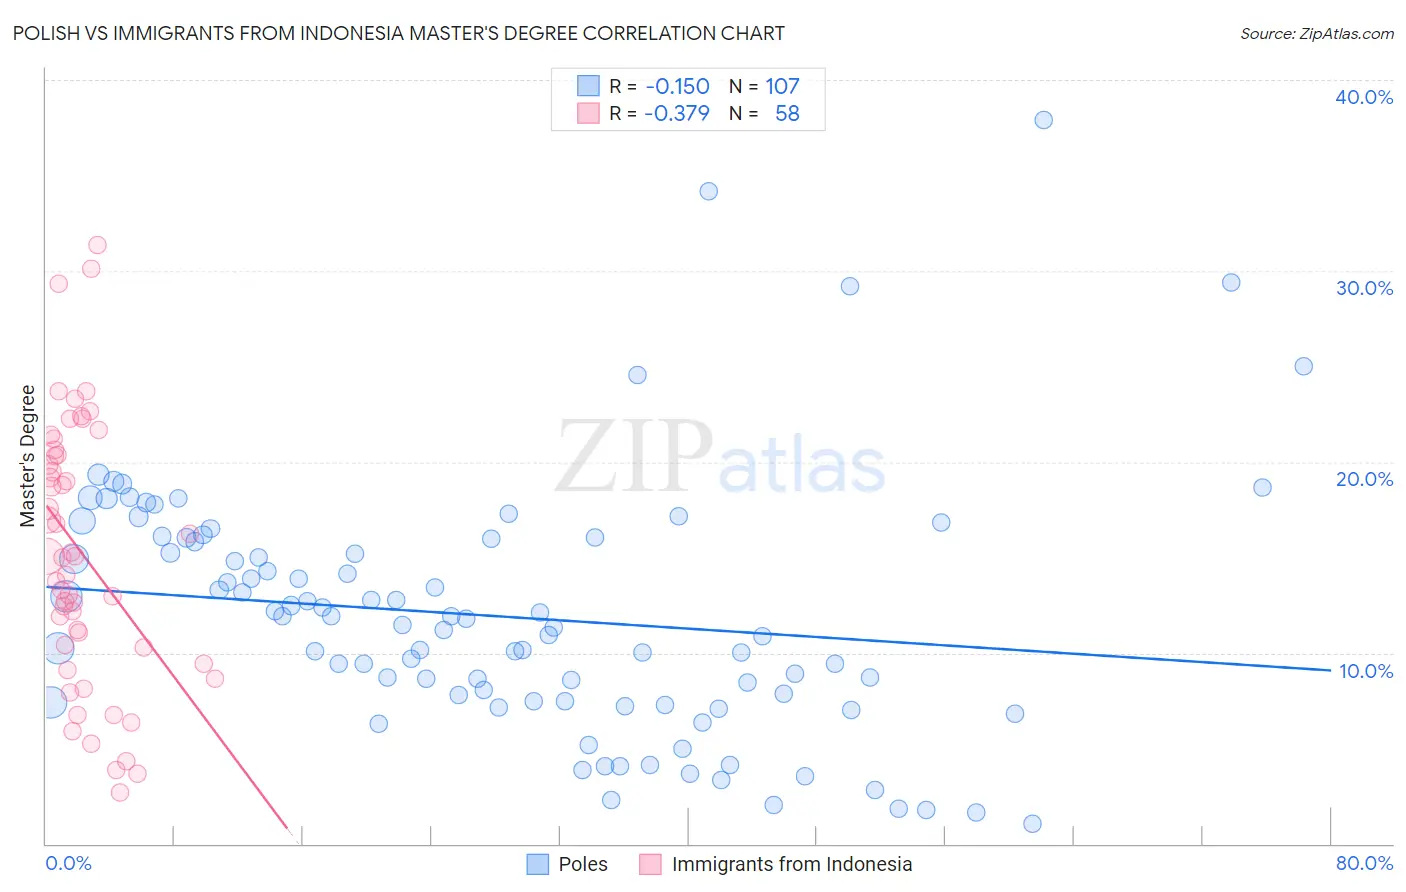
Polish vs Immigrants from Indonesia Master's Degree Correlation Chart
The statistical analysis conducted on geographies consisting of 559,882,025 people shows a poor negative correlation between the proportion of Poles and percentage of population with at least master's degree education in the United States with a correlation coefficient (R) of -0.150 and weighted average of 15.7%. Similarly, the statistical analysis conducted on geographies consisting of 215,754,455 people shows a mild negative correlation between the proportion of Immigrants from Indonesia and percentage of population with at least master's degree education in the United States with a correlation coefficient (R) of -0.379 and weighted average of 17.6%, a difference of 11.7%.
Master's Degree Correlation Summary
| Measurement | Polish | Immigrants from Indonesia |
| Minimum | 1.0% | 2.7% |
| Maximum | 37.9% | 31.4% |
| Range | 36.9% | 28.7% |
| Mean | 11.9% | 15.2% |
| Median | 11.5% | 15.0% |
| Interquartile 25% (IQ1) | 7.4% | 10.3% |
| Interquartile 75% (IQ3) | 16.0% | 20.4% |
| Interquartile Range (IQR) | 8.5% | 10.0% |
| Standard Deviation (Sample) | 6.6% | 6.9% |
| Standard Deviation (Population) | 6.6% | 6.8% |
Similar Demographics by Master's Degree
Demographics Similar to Poles by Master's Degree
In terms of master's degree, the demographic groups most similar to Poles are Vietnamese (15.8%, a difference of 0.12%), Immigrants from Germany (15.8%, a difference of 0.21%), Immigrants from Africa (15.7%, a difference of 0.23%), Pakistani (15.8%, a difference of 0.27%), and Immigrants from Venezuela (15.7%, a difference of 0.32%).
| Demographics | Rating | Rank | Master's Degree |
| Venezuelans | 88.4 /100 | #134 | Excellent 15.9% |
| South American Indians | 88.4 /100 | #135 | Excellent 15.9% |
| Assyrians/Chaldeans/Syriacs | 86.8 /100 | #136 | Excellent 15.8% |
| Europeans | 86.4 /100 | #137 | Excellent 15.8% |
| Pakistanis | 86.1 /100 | #138 | Excellent 15.8% |
| Immigrants | Germany | 85.9 /100 | #139 | Excellent 15.8% |
| Vietnamese | 85.5 /100 | #140 | Excellent 15.8% |
| Poles | 85.0 /100 | #141 | Excellent 15.7% |
| Immigrants | Africa | 84.0 /100 | #142 | Excellent 15.7% |
| Immigrants | Venezuela | 83.6 /100 | #143 | Excellent 15.7% |
| Canadians | 83.3 /100 | #144 | Excellent 15.7% |
| South Americans | 81.3 /100 | #145 | Excellent 15.6% |
| Immigrants | Afghanistan | 79.4 /100 | #146 | Good 15.6% |
| Hungarians | 79.1 /100 | #147 | Good 15.6% |
| Immigrants | Senegal | 78.2 /100 | #148 | Good 15.5% |
Demographics Similar to Immigrants from Indonesia by Master's Degree
In terms of master's degree, the demographic groups most similar to Immigrants from Indonesia are Egyptian (17.6%, a difference of 0.030%), Immigrants from Eastern Europe (17.6%, a difference of 0.12%), Immigrants from Hungary (17.5%, a difference of 0.31%), Immigrants from Romania (17.7%, a difference of 0.40%), and Immigrants from Lebanon (17.5%, a difference of 0.45%).
| Demographics | Rating | Rank | Master's Degree |
| Immigrants | Uzbekistan | 99.8 /100 | #69 | Exceptional 17.9% |
| Immigrants | Western Europe | 99.8 /100 | #70 | Exceptional 17.8% |
| Immigrants | Pakistan | 99.7 /100 | #71 | Exceptional 17.8% |
| Lithuanians | 99.7 /100 | #72 | Exceptional 17.7% |
| Zimbabweans | 99.7 /100 | #73 | Exceptional 17.7% |
| Immigrants | Romania | 99.7 /100 | #74 | Exceptional 17.7% |
| Egyptians | 99.6 /100 | #75 | Exceptional 17.6% |
| Immigrants | Indonesia | 99.6 /100 | #76 | Exceptional 17.6% |
| Immigrants | Eastern Europe | 99.6 /100 | #77 | Exceptional 17.6% |
| Immigrants | Hungary | 99.6 /100 | #78 | Exceptional 17.5% |
| Immigrants | Lebanon | 99.6 /100 | #79 | Exceptional 17.5% |
| Carpatho Rusyns | 99.6 /100 | #80 | Exceptional 17.5% |
| Immigrants | Western Asia | 99.5 /100 | #81 | Exceptional 17.5% |
| Greeks | 99.5 /100 | #82 | Exceptional 17.5% |
| Immigrants | Zimbabwe | 99.5 /100 | #83 | Exceptional 17.4% |