Swiss vs Immigrants from Austria Median Household Income
COMPARE
Swiss
Immigrants from Austria
Median Household Income
Median Household Income Comparison
Swiss
Immigrants from Austria
$85,681
MEDIAN HOUSEHOLD INCOME
59.2/ 100
METRIC RATING
170th/ 347
METRIC RANK
$95,277
MEDIAN HOUSEHOLD INCOME
99.9/ 100
METRIC RATING
56th/ 347
METRIC RANK
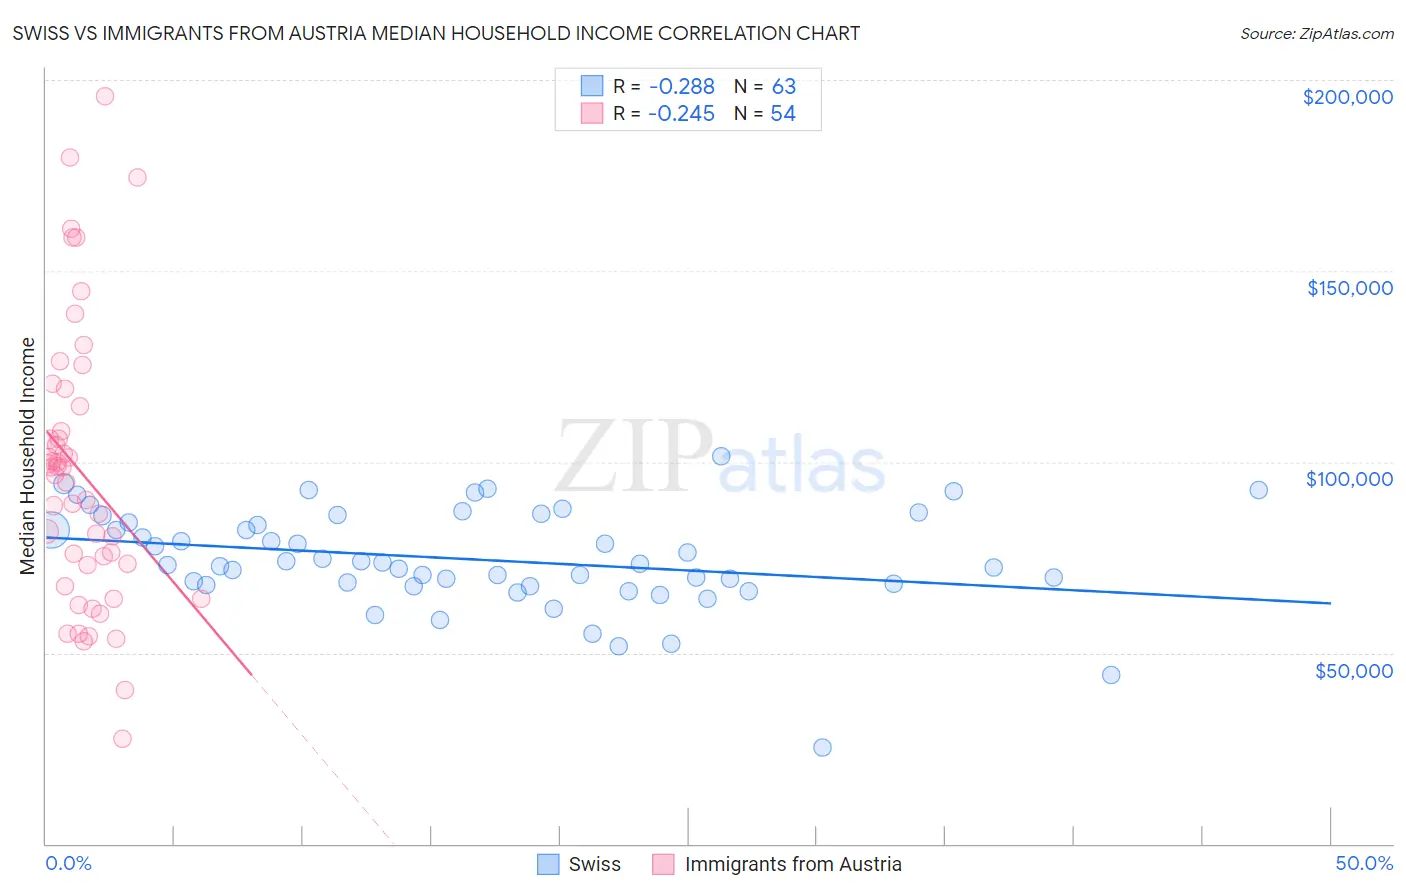
Swiss vs Immigrants from Austria Median Household Income Correlation Chart
The statistical analysis conducted on geographies consisting of 464,626,684 people shows a weak negative correlation between the proportion of Swiss and median household income in the United States with a correlation coefficient (R) of -0.288 and weighted average of $85,681. Similarly, the statistical analysis conducted on geographies consisting of 167,955,679 people shows a weak negative correlation between the proportion of Immigrants from Austria and median household income in the United States with a correlation coefficient (R) of -0.245 and weighted average of $95,277, a difference of 11.2%.
Median Household Income Correlation Summary
| Measurement | Swiss | Immigrants from Austria |
| Minimum | $25,245 | $27,500 |
| Maximum | $101,562 | $195,784 |
| Range | $76,317 | $168,284 |
| Mean | $74,409 | $97,293 |
| Median | $73,303 | $97,556 |
| Interquartile 25% (IQ1) | $67,788 | $73,089 |
| Interquartile 75% (IQ3) | $84,144 | $114,543 |
| Interquartile Range (IQR) | $16,356 | $41,455 |
| Standard Deviation (Sample) | $13,178 | $36,453 |
| Standard Deviation (Population) | $13,073 | $36,114 |
Similar Demographics by Median Household Income
Demographics Similar to Swiss by Median Household Income
In terms of median household income, the demographic groups most similar to Swiss are Colombian ($85,716, a difference of 0.040%), Immigrants from South America ($85,611, a difference of 0.080%), Icelander ($85,797, a difference of 0.14%), Slovene ($85,562, a difference of 0.14%), and Immigrants ($85,818, a difference of 0.16%).
| Demographics | Rating | Rank | Median Household Income |
| Czechs | 66.4 /100 | #163 | Good $86,164 |
| Irish | 66.2 /100 | #164 | Good $86,145 |
| Norwegians | 65.3 /100 | #165 | Good $86,084 |
| Scandinavians | 65.1 /100 | #166 | Good $86,073 |
| Immigrants | Immigrants | 61.3 /100 | #167 | Good $85,818 |
| Icelanders | 61.0 /100 | #168 | Good $85,797 |
| Colombians | 59.7 /100 | #169 | Average $85,716 |
| Swiss | 59.2 /100 | #170 | Average $85,681 |
| Immigrants | South America | 58.1 /100 | #171 | Average $85,611 |
| Slovenes | 57.4 /100 | #172 | Average $85,562 |
| Immigrants | Cameroon | 53.4 /100 | #173 | Average $85,314 |
| Scottish | 50.0 /100 | #174 | Average $85,101 |
| Immigrants | Costa Rica | 49.2 /100 | #175 | Average $85,054 |
| Alsatians | 49.2 /100 | #176 | Average $85,053 |
| Immigrants | Eritrea | 48.8 /100 | #177 | Average $85,025 |
Demographics Similar to Immigrants from Austria by Median Household Income
In terms of median household income, the demographic groups most similar to Immigrants from Austria are Immigrants from Czechoslovakia ($95,319, a difference of 0.040%), New Zealander ($95,146, a difference of 0.14%), Soviet Union ($95,098, a difference of 0.19%), Immigrants from Europe ($95,032, a difference of 0.26%), and Korean ($95,018, a difference of 0.27%).
| Demographics | Rating | Rank | Median Household Income |
| Immigrants | Malaysia | 99.9 /100 | #49 | Exceptional $96,292 |
| Bulgarians | 99.9 /100 | #50 | Exceptional $96,290 |
| Estonians | 99.9 /100 | #51 | Exceptional $95,930 |
| Immigrants | South Africa | 99.9 /100 | #52 | Exceptional $95,800 |
| Paraguayans | 99.9 /100 | #53 | Exceptional $95,737 |
| Egyptians | 99.9 /100 | #54 | Exceptional $95,673 |
| Immigrants | Czechoslovakia | 99.9 /100 | #55 | Exceptional $95,319 |
| Immigrants | Austria | 99.9 /100 | #56 | Exceptional $95,277 |
| New Zealanders | 99.8 /100 | #57 | Exceptional $95,146 |
| Soviet Union | 99.8 /100 | #58 | Exceptional $95,098 |
| Immigrants | Europe | 99.8 /100 | #59 | Exceptional $95,032 |
| Koreans | 99.8 /100 | #60 | Exceptional $95,018 |
| Laotians | 99.8 /100 | #61 | Exceptional $94,990 |
| Immigrants | Norway | 99.8 /100 | #62 | Exceptional $94,846 |
| Greeks | 99.8 /100 | #63 | Exceptional $94,735 |