Osage vs Immigrants from Singapore Wage/Income Gap
COMPARE
Osage
Immigrants from Singapore
Wage/Income Gap
Wage/Income Gap Comparison
Osage
Immigrants from Singapore
27.1%
WAGE/INCOME GAP
4.4/ 100
METRIC RATING
238th/ 347
METRIC RANK
28.9%
WAGE/INCOME GAP
0.1/ 100
METRIC RATING
322nd/ 347
METRIC RANK
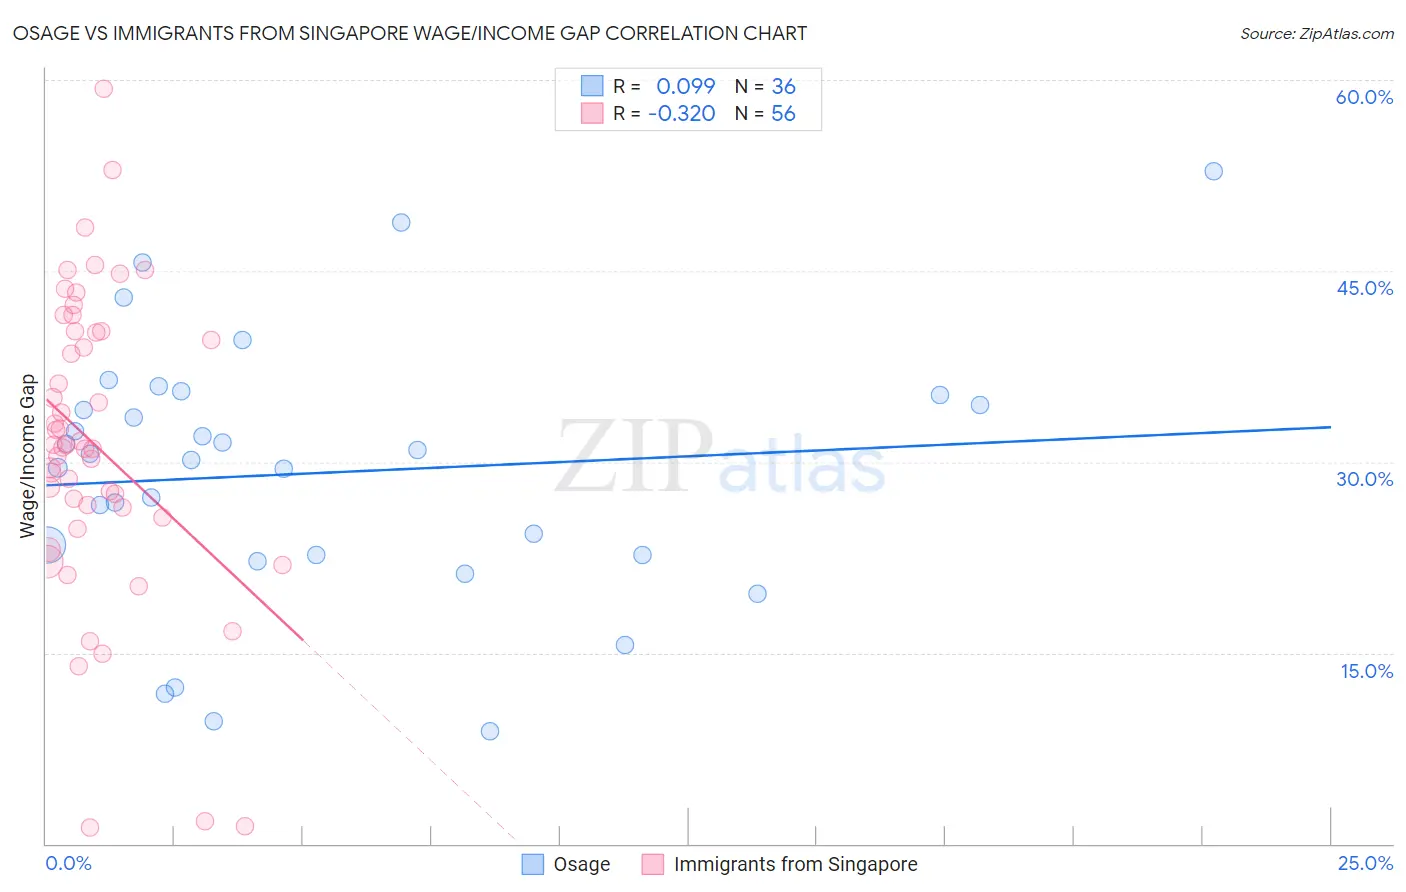
Osage vs Immigrants from Singapore Wage/Income Gap Correlation Chart
The statistical analysis conducted on geographies consisting of 91,772,804 people shows a slight positive correlation between the proportion of Osage and wage/income gap percentage in the United States with a correlation coefficient (R) of 0.099 and weighted average of 27.1%. Similarly, the statistical analysis conducted on geographies consisting of 137,510,142 people shows a mild negative correlation between the proportion of Immigrants from Singapore and wage/income gap percentage in the United States with a correlation coefficient (R) of -0.320 and weighted average of 28.9%, a difference of 6.9%.
Wage/Income Gap Correlation Summary
| Measurement | Osage | Immigrants from Singapore |
| Minimum | 8.8% | 1.3% |
| Maximum | 52.9% | 59.3% |
| Range | 44.1% | 58.0% |
| Mean | 29.1% | 31.3% |
| Median | 30.4% | 31.2% |
| Interquartile 25% (IQ1) | 22.6% | 26.0% |
| Interquartile 75% (IQ3) | 34.9% | 40.2% |
| Interquartile Range (IQR) | 12.2% | 14.2% |
| Standard Deviation (Sample) | 10.3% | 11.9% |
| Standard Deviation (Population) | 10.2% | 11.8% |
Similar Demographics by Wage/Income Gap
Demographics Similar to Osage by Wage/Income Gap
In terms of wage/income gap, the demographic groups most similar to Osage are Immigrants from Eastern Asia (27.1%, a difference of 0.0%), Estonian (27.1%, a difference of 0.020%), Immigrants from Romania (27.0%, a difference of 0.15%), Immigrants from Hungary (27.0%, a difference of 0.16%), and Immigrants from Pakistan (27.0%, a difference of 0.18%).
| Demographics | Rating | Rank | Wage/Income Gap |
| Bhutanese | 5.3 /100 | #231 | Tragic 27.0% |
| Argentineans | 5.2 /100 | #232 | Tragic 27.0% |
| Immigrants | Brazil | 5.0 /100 | #233 | Tragic 27.0% |
| Immigrants | Pakistan | 4.9 /100 | #234 | Tragic 27.0% |
| Immigrants | Hungary | 4.8 /100 | #235 | Tragic 27.0% |
| Immigrants | Romania | 4.8 /100 | #236 | Tragic 27.0% |
| Immigrants | Eastern Asia | 4.4 /100 | #237 | Tragic 27.1% |
| Osage | 4.4 /100 | #238 | Tragic 27.1% |
| Estonians | 4.3 /100 | #239 | Tragic 27.1% |
| Immigrants | Europe | 3.8 /100 | #240 | Tragic 27.1% |
| Creek | 3.8 /100 | #241 | Tragic 27.1% |
| Immigrants | Sri Lanka | 3.7 /100 | #242 | Tragic 27.1% |
| Spanish | 3.6 /100 | #243 | Tragic 27.1% |
| Chickasaw | 3.5 /100 | #244 | Tragic 27.2% |
| Immigrants | Azores | 3.5 /100 | #245 | Tragic 27.2% |
Demographics Similar to Immigrants from Singapore by Wage/Income Gap
In terms of wage/income gap, the demographic groups most similar to Immigrants from Singapore are Welsh (28.9%, a difference of 0.020%), British (28.9%, a difference of 0.080%), Norwegian (29.0%, a difference of 0.11%), Slovak (28.9%, a difference of 0.15%), and Croatian (29.0%, a difference of 0.23%).
| Demographics | Rating | Rank | Wage/Income Gap |
| Maltese | 0.1 /100 | #315 | Tragic 28.7% |
| Lithuanians | 0.1 /100 | #316 | Tragic 28.7% |
| Belgians | 0.1 /100 | #317 | Tragic 28.8% |
| Basques | 0.1 /100 | #318 | Tragic 28.8% |
| Slovaks | 0.1 /100 | #319 | Tragic 28.9% |
| British | 0.1 /100 | #320 | Tragic 28.9% |
| Welsh | 0.1 /100 | #321 | Tragic 28.9% |
| Immigrants | Singapore | 0.1 /100 | #322 | Tragic 28.9% |
| Norwegians | 0.1 /100 | #323 | Tragic 29.0% |
| Croatians | 0.0 /100 | #324 | Tragic 29.0% |
| Hungarians | 0.0 /100 | #325 | Tragic 29.0% |
| Immigrants | Belgium | 0.0 /100 | #326 | Tragic 29.0% |
| Immigrants | Iran | 0.0 /100 | #327 | Tragic 29.1% |
| Scandinavians | 0.0 /100 | #328 | Tragic 29.1% |
| Scottish | 0.0 /100 | #329 | Tragic 29.1% |