Osage vs Bahamian Wage/Income Gap
COMPARE
Osage
Bahamian
Wage/Income Gap
Wage/Income Gap Comparison
Osage
Bahamians
27.1%
WAGE/INCOME GAP
4.4/ 100
METRIC RATING
238th/ 347
METRIC RANK
20.2%
WAGE/INCOME GAP
100.0/ 100
METRIC RATING
20th/ 347
METRIC RANK
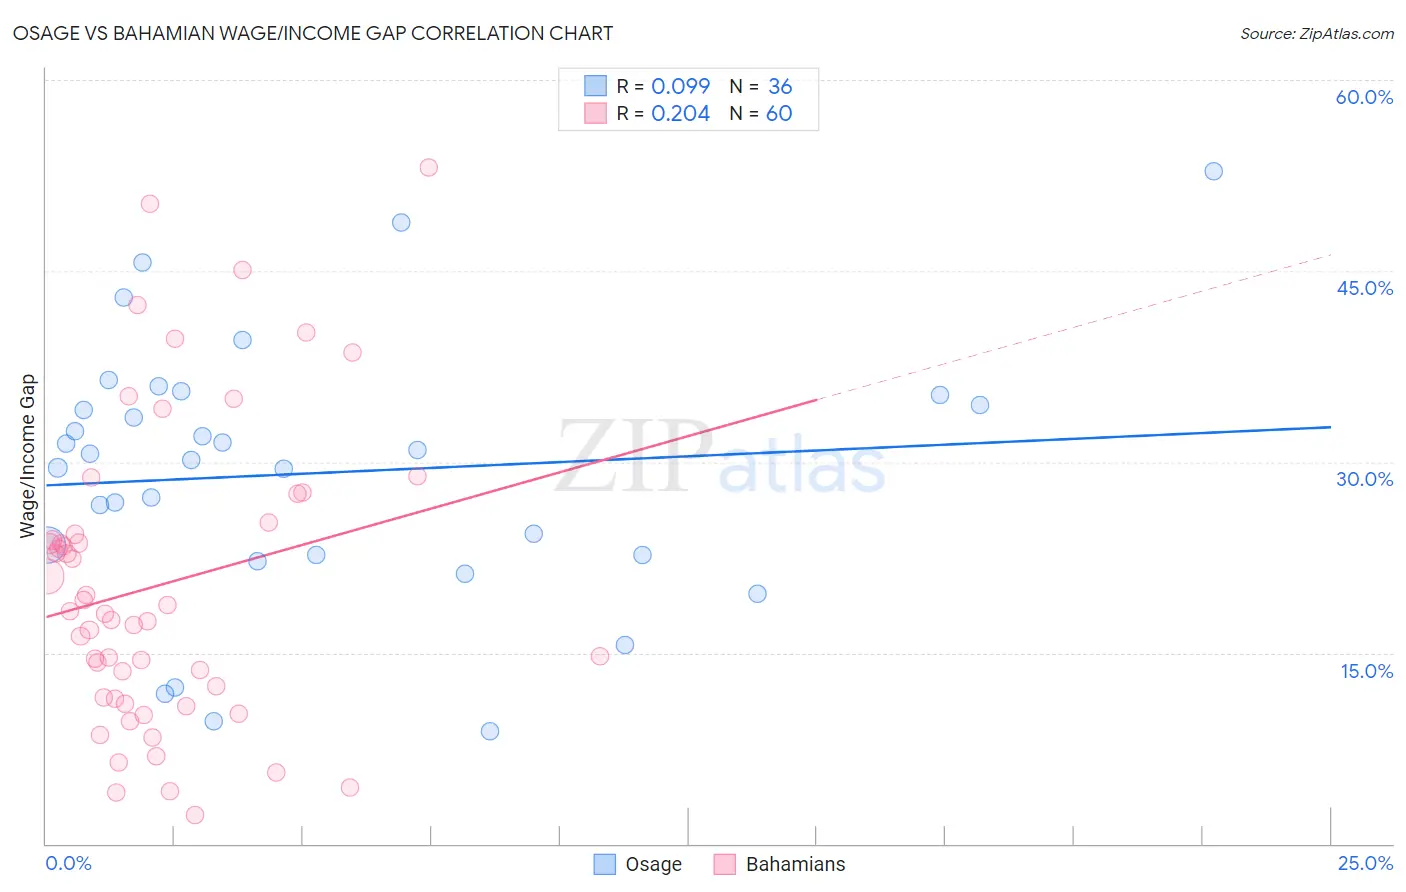
Osage vs Bahamian Wage/Income Gap Correlation Chart
The statistical analysis conducted on geographies consisting of 91,772,804 people shows a slight positive correlation between the proportion of Osage and wage/income gap percentage in the United States with a correlation coefficient (R) of 0.099 and weighted average of 27.1%. Similarly, the statistical analysis conducted on geographies consisting of 112,648,688 people shows a weak positive correlation between the proportion of Bahamians and wage/income gap percentage in the United States with a correlation coefficient (R) of 0.204 and weighted average of 20.2%, a difference of 33.7%.
Wage/Income Gap Correlation Summary
| Measurement | Osage | Bahamian |
| Minimum | 8.8% | 2.2% |
| Maximum | 52.9% | 53.2% |
| Range | 44.1% | 50.9% |
| Mean | 29.1% | 20.4% |
| Median | 30.4% | 18.1% |
| Interquartile 25% (IQ1) | 22.6% | 11.4% |
| Interquartile 75% (IQ3) | 34.9% | 24.8% |
| Interquartile Range (IQR) | 12.2% | 13.4% |
| Standard Deviation (Sample) | 10.3% | 11.8% |
| Standard Deviation (Population) | 10.2% | 11.7% |
Similar Demographics by Wage/Income Gap
Demographics Similar to Osage by Wage/Income Gap
In terms of wage/income gap, the demographic groups most similar to Osage are Immigrants from Eastern Asia (27.1%, a difference of 0.0%), Estonian (27.1%, a difference of 0.020%), Immigrants from Romania (27.0%, a difference of 0.15%), Immigrants from Hungary (27.0%, a difference of 0.16%), and Immigrants from Pakistan (27.0%, a difference of 0.18%).
| Demographics | Rating | Rank | Wage/Income Gap |
| Bhutanese | 5.3 /100 | #231 | Tragic 27.0% |
| Argentineans | 5.2 /100 | #232 | Tragic 27.0% |
| Immigrants | Brazil | 5.0 /100 | #233 | Tragic 27.0% |
| Immigrants | Pakistan | 4.9 /100 | #234 | Tragic 27.0% |
| Immigrants | Hungary | 4.8 /100 | #235 | Tragic 27.0% |
| Immigrants | Romania | 4.8 /100 | #236 | Tragic 27.0% |
| Immigrants | Eastern Asia | 4.4 /100 | #237 | Tragic 27.1% |
| Osage | 4.4 /100 | #238 | Tragic 27.1% |
| Estonians | 4.3 /100 | #239 | Tragic 27.1% |
| Immigrants | Europe | 3.8 /100 | #240 | Tragic 27.1% |
| Creek | 3.8 /100 | #241 | Tragic 27.1% |
| Immigrants | Sri Lanka | 3.7 /100 | #242 | Tragic 27.1% |
| Spanish | 3.6 /100 | #243 | Tragic 27.1% |
| Chickasaw | 3.5 /100 | #244 | Tragic 27.2% |
| Immigrants | Azores | 3.5 /100 | #245 | Tragic 27.2% |
Demographics Similar to Bahamians by Wage/Income Gap
In terms of wage/income gap, the demographic groups most similar to Bahamians are Immigrants from Caribbean (20.4%, a difference of 0.72%), Immigrants from Dominica (20.0%, a difference of 1.1%), Hopi (20.0%, a difference of 1.2%), Immigrants from Liberia (20.6%, a difference of 1.5%), and Immigrants from Dominican Republic (20.6%, a difference of 1.5%).
| Demographics | Rating | Rank | Wage/Income Gap |
| Trinidadians and Tobagonians | 100.0 /100 | #13 | Exceptional 19.3% |
| Immigrants | Trinidad and Tobago | 100.0 /100 | #14 | Exceptional 19.3% |
| West Indians | 100.0 /100 | #15 | Exceptional 19.6% |
| Jamaicans | 100.0 /100 | #16 | Exceptional 19.6% |
| Haitians | 100.0 /100 | #17 | Exceptional 19.7% |
| Hopi | 100.0 /100 | #18 | Exceptional 20.0% |
| Immigrants | Dominica | 100.0 /100 | #19 | Exceptional 20.0% |
| Bahamians | 100.0 /100 | #20 | Exceptional 20.2% |
| Immigrants | Caribbean | 100.0 /100 | #21 | Exceptional 20.4% |
| Immigrants | Liberia | 100.0 /100 | #22 | Exceptional 20.6% |
| Immigrants | Dominican Republic | 100.0 /100 | #23 | Exceptional 20.6% |
| Dominicans | 100.0 /100 | #24 | Exceptional 20.6% |
| Senegalese | 100.0 /100 | #25 | Exceptional 20.7% |
| Pueblo | 100.0 /100 | #26 | Exceptional 20.7% |
| Immigrants | Armenia | 100.0 /100 | #27 | Exceptional 20.7% |