Armenian vs Immigrants from Singapore Wage/Income Gap
COMPARE
Armenian
Immigrants from Singapore
Wage/Income Gap
Wage/Income Gap Comparison
Armenians
Immigrants from Singapore
24.8%
WAGE/INCOME GAP
91.3/ 100
METRIC RATING
136th/ 347
METRIC RANK
28.9%
WAGE/INCOME GAP
0.1/ 100
METRIC RATING
322nd/ 347
METRIC RANK
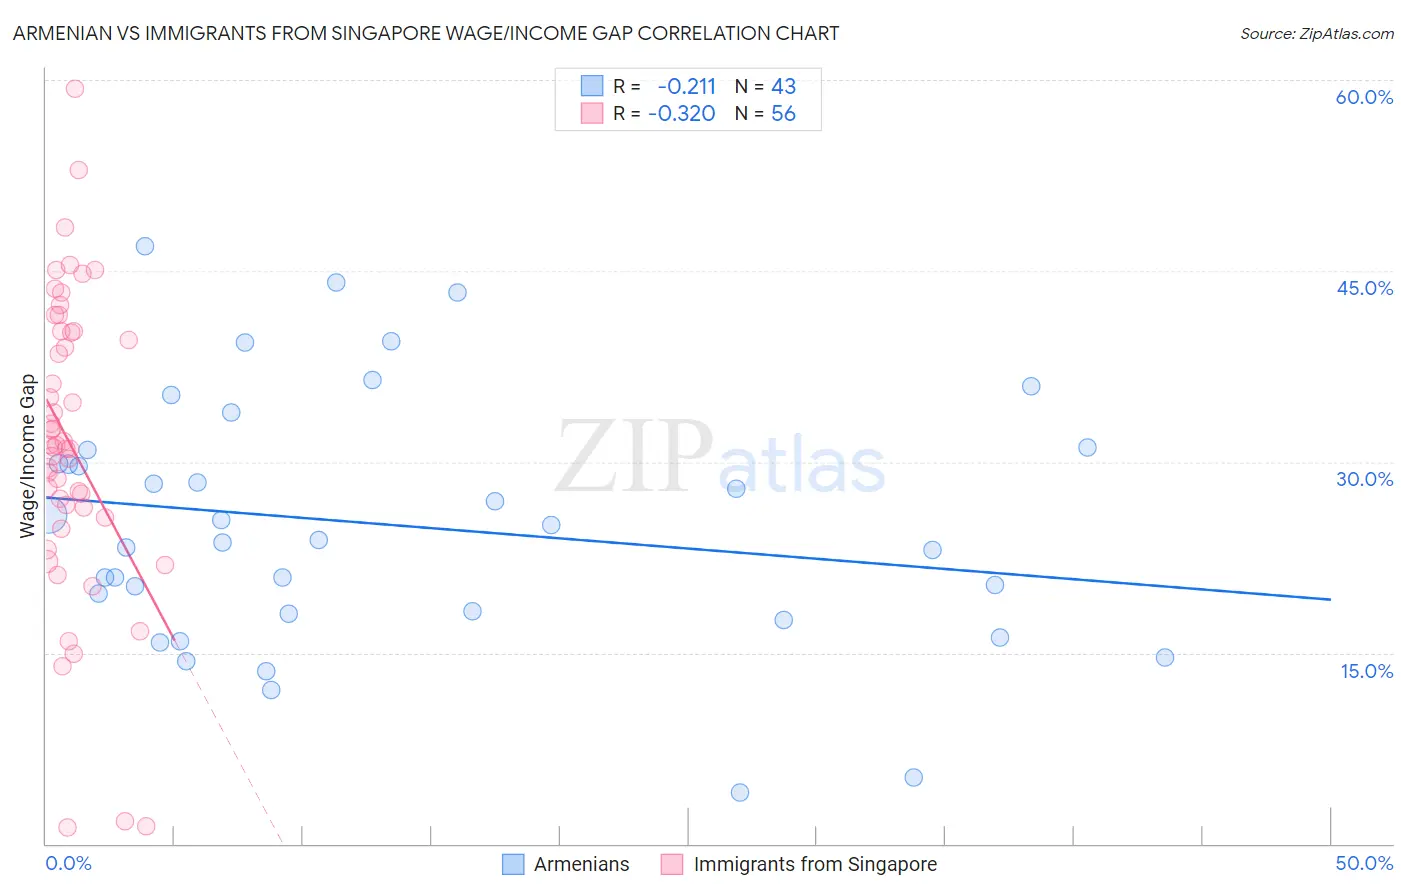
Armenian vs Immigrants from Singapore Wage/Income Gap Correlation Chart
The statistical analysis conducted on geographies consisting of 310,772,070 people shows a weak negative correlation between the proportion of Armenians and wage/income gap percentage in the United States with a correlation coefficient (R) of -0.211 and weighted average of 24.8%. Similarly, the statistical analysis conducted on geographies consisting of 137,510,142 people shows a mild negative correlation between the proportion of Immigrants from Singapore and wage/income gap percentage in the United States with a correlation coefficient (R) of -0.320 and weighted average of 28.9%, a difference of 16.7%.
Wage/Income Gap Correlation Summary
| Measurement | Armenian | Immigrants from Singapore |
| Minimum | 4.0% | 1.3% |
| Maximum | 46.9% | 59.3% |
| Range | 42.9% | 58.0% |
| Mean | 25.0% | 31.3% |
| Median | 23.9% | 31.2% |
| Interquartile 25% (IQ1) | 18.0% | 26.0% |
| Interquartile 75% (IQ3) | 30.9% | 40.2% |
| Interquartile Range (IQR) | 12.9% | 14.2% |
| Standard Deviation (Sample) | 9.9% | 11.9% |
| Standard Deviation (Population) | 9.7% | 11.8% |
Similar Demographics by Wage/Income Gap
Demographics Similar to Armenians by Wage/Income Gap
In terms of wage/income gap, the demographic groups most similar to Armenians are Immigrants from South Eastern Asia (24.8%, a difference of 0.080%), South American Indian (24.7%, a difference of 0.14%), Mexican American Indian (24.7%, a difference of 0.20%), Immigrants from Costa Rica (24.7%, a difference of 0.24%), and Colombian (24.7%, a difference of 0.24%).
| Demographics | Rating | Rank | Wage/Income Gap |
| Yup'ik | 93.3 /100 | #129 | Exceptional 24.7% |
| Alsatians | 93.2 /100 | #130 | Exceptional 24.7% |
| Immigrants | Philippines | 93.0 /100 | #131 | Exceptional 24.7% |
| Immigrants | Costa Rica | 92.4 /100 | #132 | Exceptional 24.7% |
| Colombians | 92.4 /100 | #133 | Exceptional 24.7% |
| Mexican American Indians | 92.2 /100 | #134 | Exceptional 24.7% |
| South American Indians | 92.0 /100 | #135 | Exceptional 24.7% |
| Armenians | 91.3 /100 | #136 | Exceptional 24.8% |
| Immigrants | South Eastern Asia | 90.9 /100 | #137 | Exceptional 24.8% |
| Immigrants | Bosnia and Herzegovina | 90.1 /100 | #138 | Exceptional 24.8% |
| Hispanics or Latinos | 89.5 /100 | #139 | Excellent 24.9% |
| Immigrants | Nepal | 89.3 /100 | #140 | Excellent 24.9% |
| Hawaiians | 89.3 /100 | #141 | Excellent 24.9% |
| Afghans | 88.1 /100 | #142 | Excellent 24.9% |
| Immigrants | Uganda | 88.0 /100 | #143 | Excellent 24.9% |
Demographics Similar to Immigrants from Singapore by Wage/Income Gap
In terms of wage/income gap, the demographic groups most similar to Immigrants from Singapore are Welsh (28.9%, a difference of 0.020%), British (28.9%, a difference of 0.080%), Norwegian (29.0%, a difference of 0.11%), Slovak (28.9%, a difference of 0.15%), and Croatian (29.0%, a difference of 0.23%).
| Demographics | Rating | Rank | Wage/Income Gap |
| Maltese | 0.1 /100 | #315 | Tragic 28.7% |
| Lithuanians | 0.1 /100 | #316 | Tragic 28.7% |
| Belgians | 0.1 /100 | #317 | Tragic 28.8% |
| Basques | 0.1 /100 | #318 | Tragic 28.8% |
| Slovaks | 0.1 /100 | #319 | Tragic 28.9% |
| British | 0.1 /100 | #320 | Tragic 28.9% |
| Welsh | 0.1 /100 | #321 | Tragic 28.9% |
| Immigrants | Singapore | 0.1 /100 | #322 | Tragic 28.9% |
| Norwegians | 0.1 /100 | #323 | Tragic 29.0% |
| Croatians | 0.0 /100 | #324 | Tragic 29.0% |
| Hungarians | 0.0 /100 | #325 | Tragic 29.0% |
| Immigrants | Belgium | 0.0 /100 | #326 | Tragic 29.0% |
| Immigrants | Iran | 0.0 /100 | #327 | Tragic 29.1% |
| Scandinavians | 0.0 /100 | #328 | Tragic 29.1% |
| Scottish | 0.0 /100 | #329 | Tragic 29.1% |