Osage vs Immigrants from Kenya Median Family Income
COMPARE
Osage
Immigrants from Kenya
Median Family Income
Median Family Income Comparison
Osage
Immigrants from Kenya
$91,926
MEDIAN FAMILY INCOME
0.4/ 100
METRIC RATING
258th/ 347
METRIC RANK
$100,679
MEDIAN FAMILY INCOME
26.5/ 100
METRIC RATING
192nd/ 347
METRIC RANK
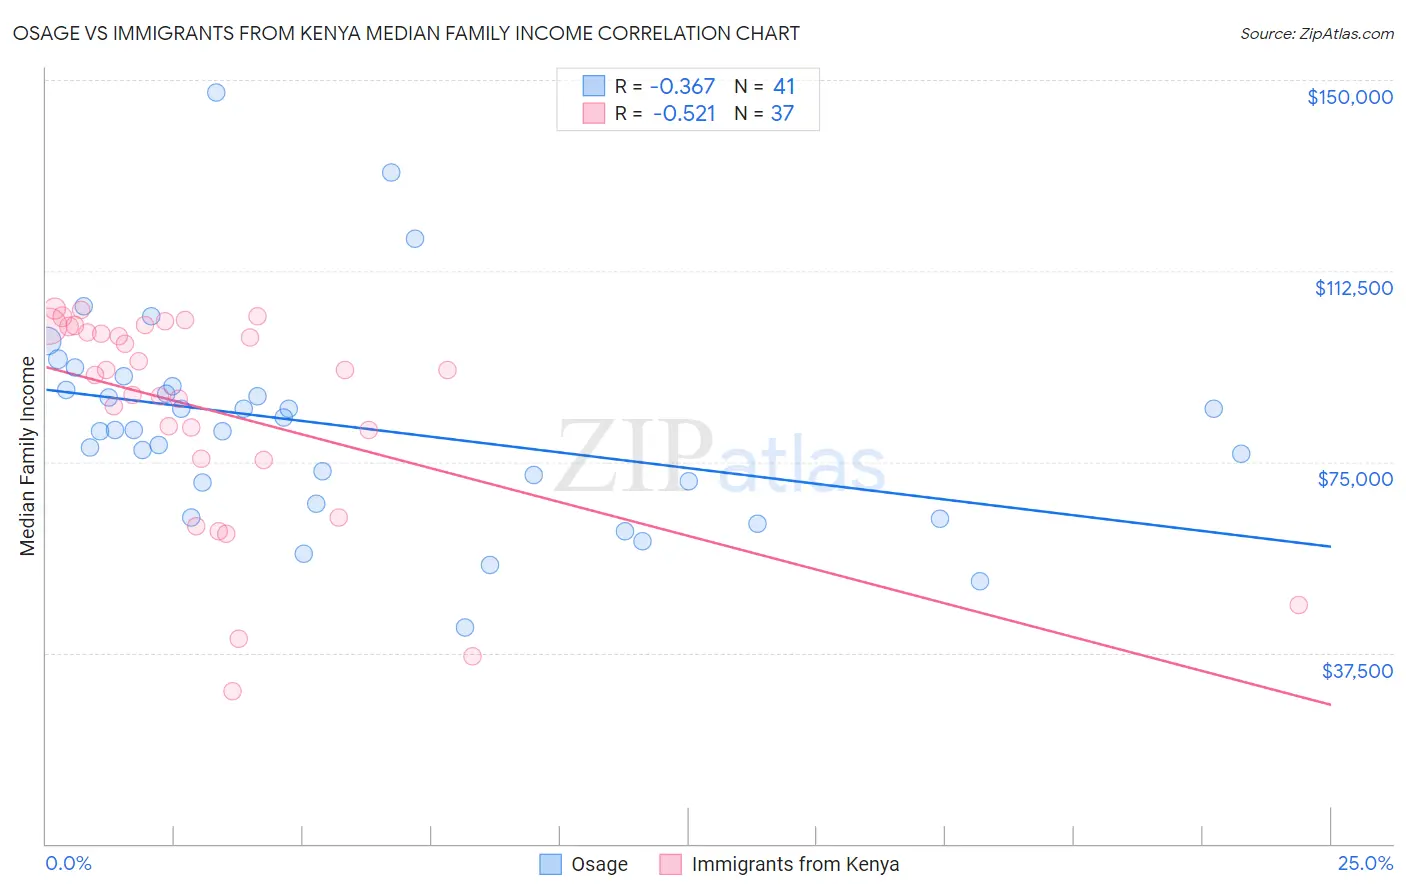
Osage vs Immigrants from Kenya Median Family Income Correlation Chart
The statistical analysis conducted on geographies consisting of 91,794,477 people shows a mild negative correlation between the proportion of Osage and median family income in the United States with a correlation coefficient (R) of -0.367 and weighted average of $91,926. Similarly, the statistical analysis conducted on geographies consisting of 217,962,146 people shows a substantial negative correlation between the proportion of Immigrants from Kenya and median family income in the United States with a correlation coefficient (R) of -0.521 and weighted average of $100,679, a difference of 9.5%.
Median Family Income Correlation Summary
| Measurement | Osage | Immigrants from Kenya |
| Minimum | $42,500 | $29,978 |
| Maximum | $147,522 | $105,113 |
| Range | $105,022 | $75,135 |
| Mean | $81,978 | $84,908 |
| Median | $81,165 | $92,944 |
| Interquartile 25% (IQ1) | $68,927 | $75,494 |
| Interquartile 75% (IQ3) | $89,553 | $101,628 |
| Interquartile Range (IQR) | $20,626 | $26,135 |
| Standard Deviation (Sample) | $20,387 | $20,915 |
| Standard Deviation (Population) | $20,137 | $20,630 |
Similar Demographics by Median Family Income
Demographics Similar to Osage by Median Family Income
In terms of median family income, the demographic groups most similar to Osage are Cape Verdean ($91,848, a difference of 0.090%), Pennsylvania German ($91,763, a difference of 0.18%), American ($92,096, a difference of 0.19%), Inupiat ($91,730, a difference of 0.21%), and Liberian ($91,722, a difference of 0.22%).
| Demographics | Rating | Rank | Median Family Income |
| Immigrants | Somalia | 0.6 /100 | #251 | Tragic $92,609 |
| Immigrants | El Salvador | 0.6 /100 | #252 | Tragic $92,545 |
| Immigrants | Guyana | 0.6 /100 | #253 | Tragic $92,513 |
| Immigrants | Barbados | 0.5 /100 | #254 | Tragic $92,419 |
| Immigrants | Laos | 0.5 /100 | #255 | Tragic $92,239 |
| Nicaraguans | 0.5 /100 | #256 | Tragic $92,231 |
| Americans | 0.4 /100 | #257 | Tragic $92,096 |
| Osage | 0.4 /100 | #258 | Tragic $91,926 |
| Cape Verdeans | 0.4 /100 | #259 | Tragic $91,848 |
| Pennsylvania Germans | 0.4 /100 | #260 | Tragic $91,763 |
| Inupiat | 0.4 /100 | #261 | Tragic $91,730 |
| Liberians | 0.4 /100 | #262 | Tragic $91,722 |
| Immigrants | West Indies | 0.3 /100 | #263 | Tragic $91,588 |
| Senegalese | 0.3 /100 | #264 | Tragic $91,475 |
| Hmong | 0.3 /100 | #265 | Tragic $91,296 |
Demographics Similar to Immigrants from Kenya by Median Family Income
In terms of median family income, the demographic groups most similar to Immigrants from Kenya are Iraqi ($100,658, a difference of 0.020%), Uruguayan ($100,656, a difference of 0.020%), Colombian ($100,750, a difference of 0.070%), Immigrants from South America ($100,414, a difference of 0.26%), and Immigrants ($100,962, a difference of 0.28%).
| Demographics | Rating | Rank | Median Family Income |
| Dutch | 31.9 /100 | #185 | Fair $101,192 |
| Celtics | 31.3 /100 | #186 | Fair $101,139 |
| Tlingit-Haida | 30.8 /100 | #187 | Fair $101,092 |
| Guamanians/Chamorros | 30.5 /100 | #188 | Fair $101,061 |
| Immigrants | Portugal | 29.6 /100 | #189 | Fair $100,984 |
| Immigrants | Immigrants | 29.4 /100 | #190 | Fair $100,962 |
| Colombians | 27.2 /100 | #191 | Fair $100,750 |
| Immigrants | Kenya | 26.5 /100 | #192 | Fair $100,679 |
| Iraqis | 26.3 /100 | #193 | Fair $100,658 |
| Uruguayans | 26.3 /100 | #194 | Fair $100,656 |
| Immigrants | South America | 23.9 /100 | #195 | Fair $100,414 |
| Samoans | 23.3 /100 | #196 | Fair $100,344 |
| Immigrants | Cameroon | 22.8 /100 | #197 | Fair $100,289 |
| Immigrants | Africa | 22.5 /100 | #198 | Fair $100,256 |
| Yugoslavians | 21.3 /100 | #199 | Fair $100,119 |