Sudanese vs Immigrants from Kenya Median Family Income
COMPARE
Sudanese
Immigrants from Kenya
Median Family Income
Median Family Income Comparison
Sudanese
Immigrants from Kenya
$96,783
MEDIAN FAMILY INCOME
4.7/ 100
METRIC RATING
220th/ 347
METRIC RANK
$100,679
MEDIAN FAMILY INCOME
26.5/ 100
METRIC RATING
192nd/ 347
METRIC RANK
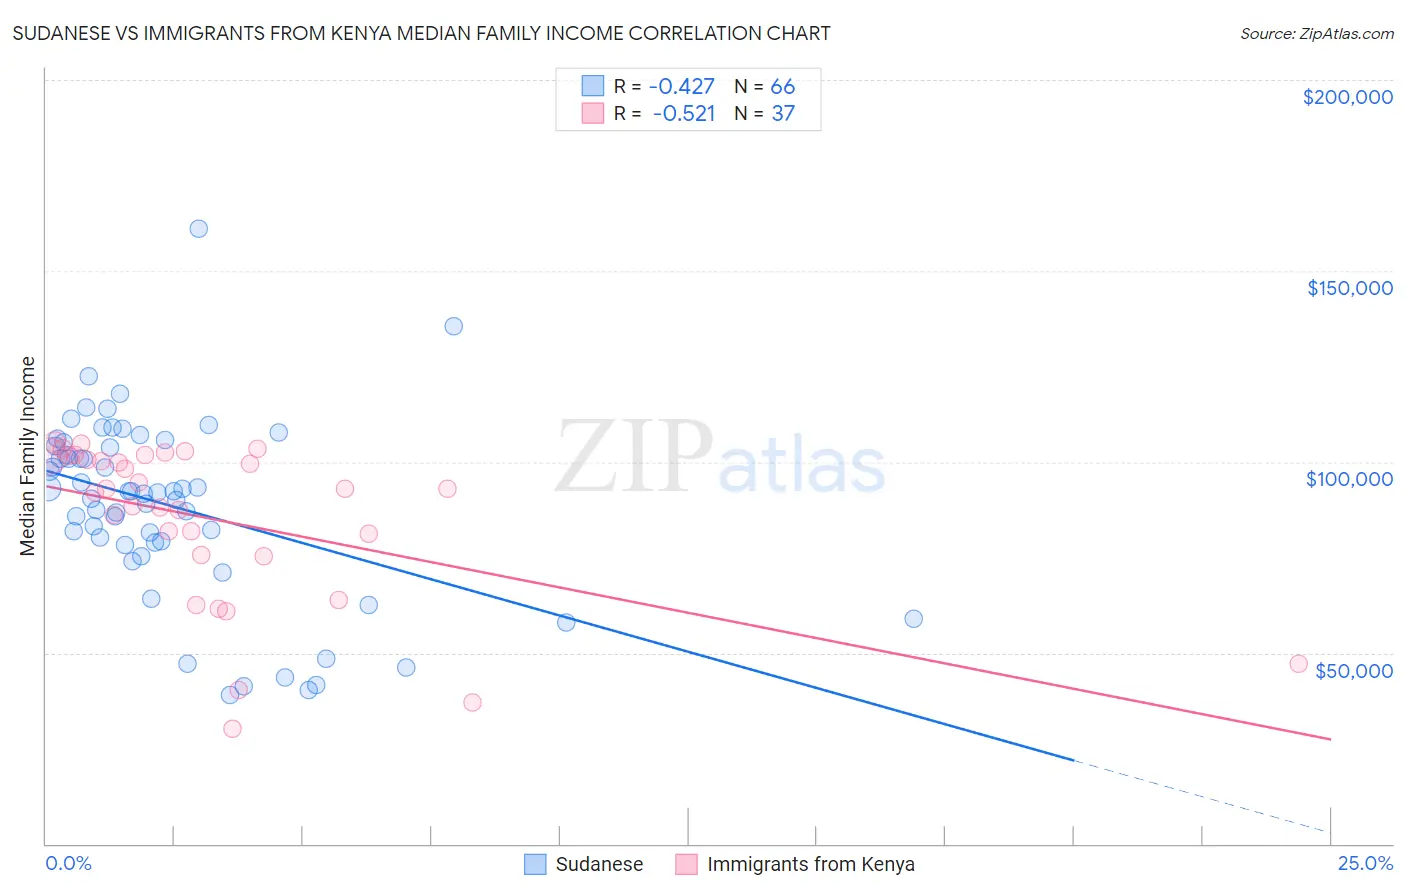
Sudanese vs Immigrants from Kenya Median Family Income Correlation Chart
The statistical analysis conducted on geographies consisting of 110,081,716 people shows a moderate negative correlation between the proportion of Sudanese and median family income in the United States with a correlation coefficient (R) of -0.427 and weighted average of $96,783. Similarly, the statistical analysis conducted on geographies consisting of 217,962,146 people shows a substantial negative correlation between the proportion of Immigrants from Kenya and median family income in the United States with a correlation coefficient (R) of -0.521 and weighted average of $100,679, a difference of 4.0%.
Median Family Income Correlation Summary
| Measurement | Sudanese | Immigrants from Kenya |
| Minimum | $38,840 | $29,978 |
| Maximum | $160,922 | $105,113 |
| Range | $122,082 | $75,135 |
| Mean | $88,541 | $84,908 |
| Median | $92,056 | $92,944 |
| Interquartile 25% (IQ1) | $78,776 | $75,494 |
| Interquartile 75% (IQ3) | $104,200 | $101,628 |
| Interquartile Range (IQR) | $25,424 | $26,135 |
| Standard Deviation (Sample) | $23,841 | $20,915 |
| Standard Deviation (Population) | $23,660 | $20,630 |
Similar Demographics by Median Family Income
Demographics Similar to Sudanese by Median Family Income
In terms of median family income, the demographic groups most similar to Sudanese are Delaware ($96,958, a difference of 0.18%), Immigrants from Ghana ($96,544, a difference of 0.25%), Immigrants from Nigeria ($96,439, a difference of 0.36%), Immigrants from Cambodia ($97,222, a difference of 0.45%), and Japanese ($97,288, a difference of 0.52%).
| Demographics | Rating | Rank | Median Family Income |
| Immigrants | Armenia | 7.0 /100 | #213 | Tragic $97,605 |
| Bermudans | 6.9 /100 | #214 | Tragic $97,577 |
| Nigerians | 6.7 /100 | #215 | Tragic $97,522 |
| Immigrants | Bosnia and Herzegovina | 6.4 /100 | #216 | Tragic $97,432 |
| Japanese | 6.0 /100 | #217 | Tragic $97,288 |
| Immigrants | Cambodia | 5.8 /100 | #218 | Tragic $97,222 |
| Delaware | 5.1 /100 | #219 | Tragic $96,958 |
| Sudanese | 4.7 /100 | #220 | Tragic $96,783 |
| Immigrants | Ghana | 4.2 /100 | #221 | Tragic $96,544 |
| Immigrants | Nigeria | 4.0 /100 | #222 | Tragic $96,439 |
| Venezuelans | 3.7 /100 | #223 | Tragic $96,281 |
| Immigrants | Nonimmigrants | 3.6 /100 | #224 | Tragic $96,231 |
| Vietnamese | 3.4 /100 | #225 | Tragic $96,123 |
| Immigrants | Panama | 2.7 /100 | #226 | Tragic $95,647 |
| Alaska Natives | 2.6 /100 | #227 | Tragic $95,573 |
Demographics Similar to Immigrants from Kenya by Median Family Income
In terms of median family income, the demographic groups most similar to Immigrants from Kenya are Iraqi ($100,658, a difference of 0.020%), Uruguayan ($100,656, a difference of 0.020%), Colombian ($100,750, a difference of 0.070%), Immigrants from South America ($100,414, a difference of 0.26%), and Immigrants ($100,962, a difference of 0.28%).
| Demographics | Rating | Rank | Median Family Income |
| Dutch | 31.9 /100 | #185 | Fair $101,192 |
| Celtics | 31.3 /100 | #186 | Fair $101,139 |
| Tlingit-Haida | 30.8 /100 | #187 | Fair $101,092 |
| Guamanians/Chamorros | 30.5 /100 | #188 | Fair $101,061 |
| Immigrants | Portugal | 29.6 /100 | #189 | Fair $100,984 |
| Immigrants | Immigrants | 29.4 /100 | #190 | Fair $100,962 |
| Colombians | 27.2 /100 | #191 | Fair $100,750 |
| Immigrants | Kenya | 26.5 /100 | #192 | Fair $100,679 |
| Iraqis | 26.3 /100 | #193 | Fair $100,658 |
| Uruguayans | 26.3 /100 | #194 | Fair $100,656 |
| Immigrants | South America | 23.9 /100 | #195 | Fair $100,414 |
| Samoans | 23.3 /100 | #196 | Fair $100,344 |
| Immigrants | Cameroon | 22.8 /100 | #197 | Fair $100,289 |
| Immigrants | Africa | 22.5 /100 | #198 | Fair $100,256 |
| Yugoslavians | 21.3 /100 | #199 | Fair $100,119 |