Osage vs Immigrants from Lebanon Median Family Income
COMPARE
Osage
Immigrants from Lebanon
Median Family Income
Median Family Income Comparison
Osage
Immigrants from Lebanon
$91,926
MEDIAN FAMILY INCOME
0.4/ 100
METRIC RATING
258th/ 347
METRIC RANK
$110,159
MEDIAN FAMILY INCOME
97.9/ 100
METRIC RATING
92nd/ 347
METRIC RANK
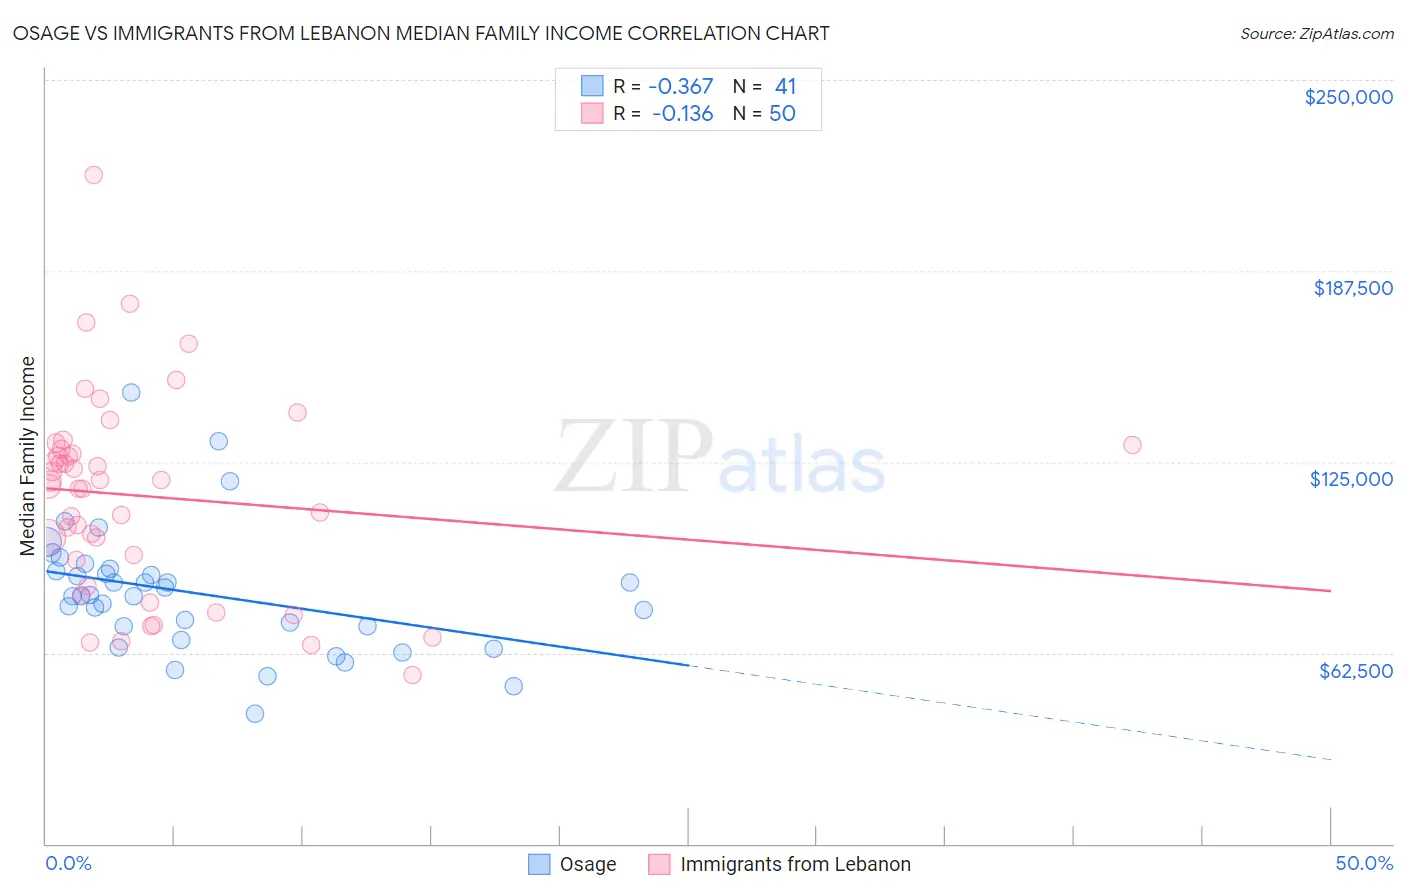
Osage vs Immigrants from Lebanon Median Family Income Correlation Chart
The statistical analysis conducted on geographies consisting of 91,794,477 people shows a mild negative correlation between the proportion of Osage and median family income in the United States with a correlation coefficient (R) of -0.367 and weighted average of $91,926. Similarly, the statistical analysis conducted on geographies consisting of 217,094,496 people shows a poor negative correlation between the proportion of Immigrants from Lebanon and median family income in the United States with a correlation coefficient (R) of -0.136 and weighted average of $110,159, a difference of 19.8%.
Median Family Income Correlation Summary
| Measurement | Osage | Immigrants from Lebanon |
| Minimum | $42,500 | $55,430 |
| Maximum | $147,522 | $218,700 |
| Range | $105,022 | $163,270 |
| Mean | $81,978 | $113,756 |
| Median | $81,165 | $117,906 |
| Interquartile 25% (IQ1) | $68,927 | $93,082 |
| Interquartile 75% (IQ3) | $89,553 | $129,106 |
| Interquartile Range (IQR) | $20,626 | $36,025 |
| Standard Deviation (Sample) | $20,387 | $32,559 |
| Standard Deviation (Population) | $20,137 | $32,232 |
Similar Demographics by Median Family Income
Demographics Similar to Osage by Median Family Income
In terms of median family income, the demographic groups most similar to Osage are Cape Verdean ($91,848, a difference of 0.090%), Pennsylvania German ($91,763, a difference of 0.18%), American ($92,096, a difference of 0.19%), Inupiat ($91,730, a difference of 0.21%), and Liberian ($91,722, a difference of 0.22%).
| Demographics | Rating | Rank | Median Family Income |
| Immigrants | Somalia | 0.6 /100 | #251 | Tragic $92,609 |
| Immigrants | El Salvador | 0.6 /100 | #252 | Tragic $92,545 |
| Immigrants | Guyana | 0.6 /100 | #253 | Tragic $92,513 |
| Immigrants | Barbados | 0.5 /100 | #254 | Tragic $92,419 |
| Immigrants | Laos | 0.5 /100 | #255 | Tragic $92,239 |
| Nicaraguans | 0.5 /100 | #256 | Tragic $92,231 |
| Americans | 0.4 /100 | #257 | Tragic $92,096 |
| Osage | 0.4 /100 | #258 | Tragic $91,926 |
| Cape Verdeans | 0.4 /100 | #259 | Tragic $91,848 |
| Pennsylvania Germans | 0.4 /100 | #260 | Tragic $91,763 |
| Inupiat | 0.4 /100 | #261 | Tragic $91,730 |
| Liberians | 0.4 /100 | #262 | Tragic $91,722 |
| Immigrants | West Indies | 0.3 /100 | #263 | Tragic $91,588 |
| Senegalese | 0.3 /100 | #264 | Tragic $91,475 |
| Hmong | 0.3 /100 | #265 | Tragic $91,296 |
Demographics Similar to Immigrants from Lebanon by Median Family Income
In terms of median family income, the demographic groups most similar to Immigrants from Lebanon are Immigrants from Kazakhstan ($110,137, a difference of 0.020%), Korean ($110,103, a difference of 0.050%), Zimbabwean ($110,011, a difference of 0.13%), Immigrants from Moldova ($109,975, a difference of 0.17%), and Jordanian ($109,865, a difference of 0.27%).
| Demographics | Rating | Rank | Median Family Income |
| Croatians | 98.8 /100 | #85 | Exceptional $111,370 |
| Ukrainians | 98.8 /100 | #86 | Exceptional $111,368 |
| Austrians | 98.8 /100 | #87 | Exceptional $111,306 |
| Romanians | 98.8 /100 | #88 | Exceptional $111,243 |
| Immigrants | Argentina | 98.5 /100 | #89 | Exceptional $110,873 |
| Northern Europeans | 98.3 /100 | #90 | Exceptional $110,635 |
| Immigrants | Southern Europe | 98.3 /100 | #91 | Exceptional $110,614 |
| Immigrants | Lebanon | 97.9 /100 | #92 | Exceptional $110,159 |
| Immigrants | Kazakhstan | 97.8 /100 | #93 | Exceptional $110,137 |
| Koreans | 97.8 /100 | #94 | Exceptional $110,103 |
| Zimbabweans | 97.7 /100 | #95 | Exceptional $110,011 |
| Immigrants | Moldova | 97.7 /100 | #96 | Exceptional $109,975 |
| Jordanians | 97.5 /100 | #97 | Exceptional $109,865 |
| Immigrants | Kuwait | 97.4 /100 | #98 | Exceptional $109,731 |
| Armenians | 97.3 /100 | #99 | Exceptional $109,692 |