Nigerian vs Trinidadian and Tobagonian Median Household Income
COMPARE
Nigerian
Trinidadian and Tobagonian
Median Household Income
Median Household Income Comparison
Nigerians
Trinidadians and Tobagonians
$81,725
MEDIAN HOUSEHOLD INCOME
10.3/ 100
METRIC RATING
219th/ 347
METRIC RANK
$80,402
MEDIAN HOUSEHOLD INCOME
4.7/ 100
METRIC RATING
231st/ 347
METRIC RANK
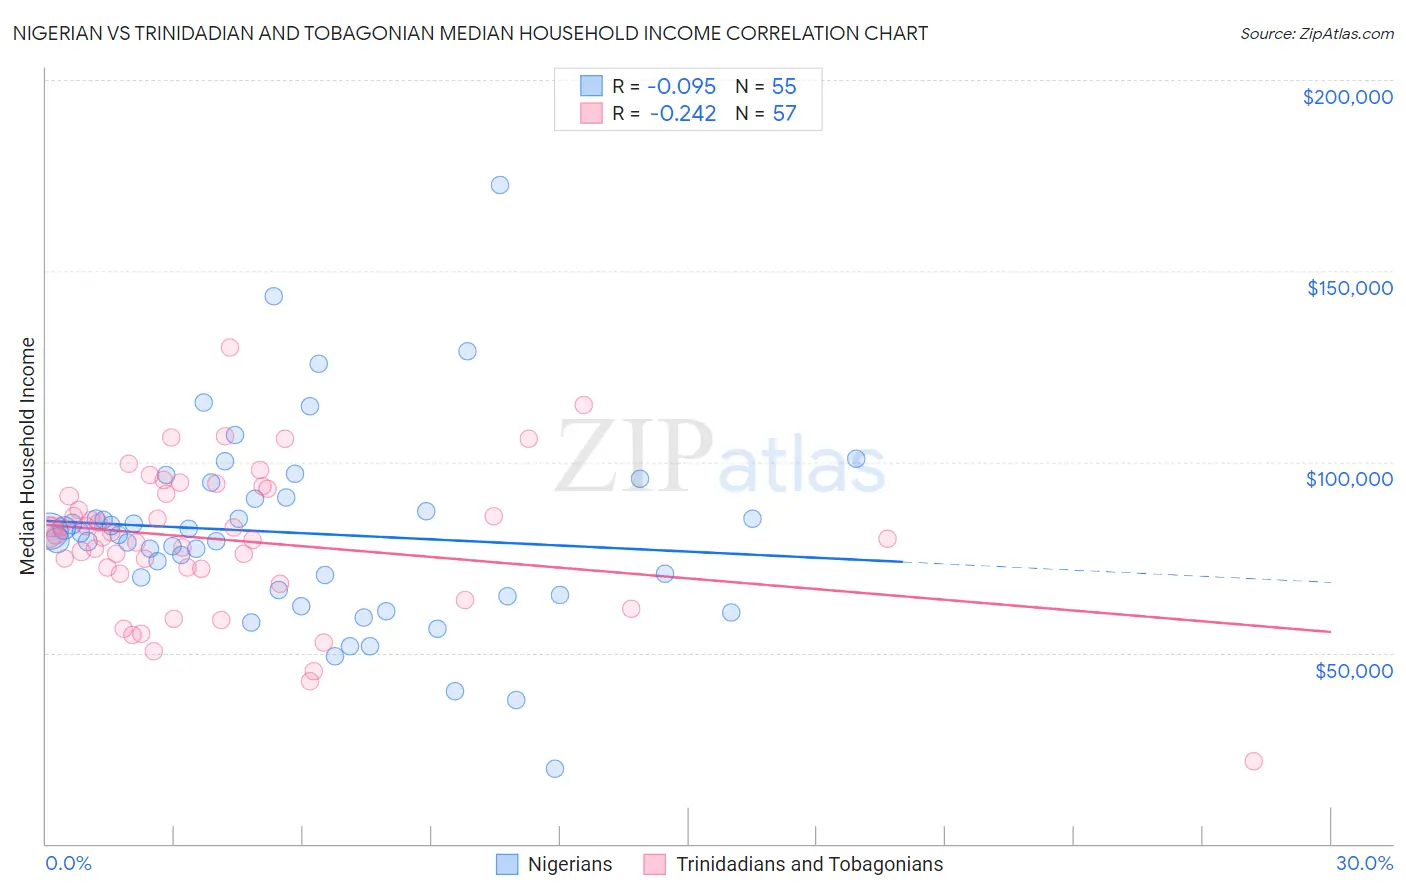
Nigerian vs Trinidadian and Tobagonian Median Household Income Correlation Chart
The statistical analysis conducted on geographies consisting of 332,385,010 people shows a slight negative correlation between the proportion of Nigerians and median household income in the United States with a correlation coefficient (R) of -0.095 and weighted average of $81,725. Similarly, the statistical analysis conducted on geographies consisting of 219,662,857 people shows a weak negative correlation between the proportion of Trinidadians and Tobagonians and median household income in the United States with a correlation coefficient (R) of -0.242 and weighted average of $80,402, a difference of 1.7%.
Median Household Income Correlation Summary
| Measurement | Nigerian | Trinidadian and Tobagonian |
| Minimum | $19,722 | $21,629 |
| Maximum | $172,388 | $129,829 |
| Range | $152,666 | $108,200 |
| Mean | $81,339 | $79,550 |
| Median | $80,919 | $80,957 |
| Interquartile 25% (IQ1) | $65,240 | $71,474 |
| Interquartile 75% (IQ3) | $90,601 | $92,337 |
| Interquartile Range (IQR) | $25,361 | $20,862 |
| Standard Deviation (Sample) | $25,635 | $19,105 |
| Standard Deviation (Population) | $25,401 | $18,937 |
Demographics Similar to Nigerians and Trinidadians and Tobagonians by Median Household Income
In terms of median household income, the demographic groups most similar to Nigerians are Immigrants from Venezuela ($81,506, a difference of 0.27%), Immigrants from Ghana ($81,489, a difference of 0.29%), White/Caucasian ($82,029, a difference of 0.37%), Ecuadorian ($82,070, a difference of 0.42%), and Yugoslavian ($82,186, a difference of 0.56%). Similarly, the demographic groups most similar to Trinidadians and Tobagonians are Bermudan ($80,406, a difference of 0.010%), Immigrants from Trinidad and Tobago ($80,373, a difference of 0.040%), Immigrants from the Azores ($80,357, a difference of 0.060%), Immigrants from Ecuador ($80,341, a difference of 0.080%), and Immigrants from Guyana ($80,324, a difference of 0.10%).
| Demographics | Rating | Rank | Median Household Income |
| Vietnamese | 13.8 /100 | #215 | Poor $82,248 |
| Yugoslavians | 13.3 /100 | #216 | Poor $82,186 |
| Ecuadorians | 12.5 /100 | #217 | Poor $82,070 |
| Whites/Caucasians | 12.2 /100 | #218 | Poor $82,029 |
| Nigerians | 10.3 /100 | #219 | Poor $81,725 |
| Immigrants | Venezuela | 9.0 /100 | #220 | Tragic $81,506 |
| Immigrants | Ghana | 9.0 /100 | #221 | Tragic $81,489 |
| Immigrants | Nigeria | 7.7 /100 | #222 | Tragic $81,236 |
| Immigrants | El Salvador | 7.6 /100 | #223 | Tragic $81,213 |
| Malaysians | 7.0 /100 | #224 | Tragic $81,064 |
| Scotch-Irish | 6.6 /100 | #225 | Tragic $80,972 |
| Immigrants | Panama | 6.2 /100 | #226 | Tragic $80,873 |
| Guyanese | 5.7 /100 | #227 | Tragic $80,734 |
| Immigrants | Bangladesh | 5.7 /100 | #228 | Tragic $80,722 |
| Delaware | 5.0 /100 | #229 | Tragic $80,527 |
| Bermudans | 4.7 /100 | #230 | Tragic $80,406 |
| Trinidadians and Tobagonians | 4.7 /100 | #231 | Tragic $80,402 |
| Immigrants | Trinidad and Tobago | 4.6 /100 | #232 | Tragic $80,373 |
| Immigrants | Azores | 4.5 /100 | #233 | Tragic $80,357 |
| Immigrants | Ecuador | 4.5 /100 | #234 | Tragic $80,341 |
| Immigrants | Guyana | 4.5 /100 | #235 | Tragic $80,324 |