Navajo vs Soviet Union Median Male Earnings
COMPARE
Navajo
Soviet Union
Median Male Earnings
Median Male Earnings Comparison
Navajo
Soviet Union
$42,098
MEDIAN MALE EARNINGS
0.0/ 100
METRIC RATING
340th/ 347
METRIC RANK
$63,382
MEDIAN MALE EARNINGS
100.0/ 100
METRIC RATING
32nd/ 347
METRIC RANK
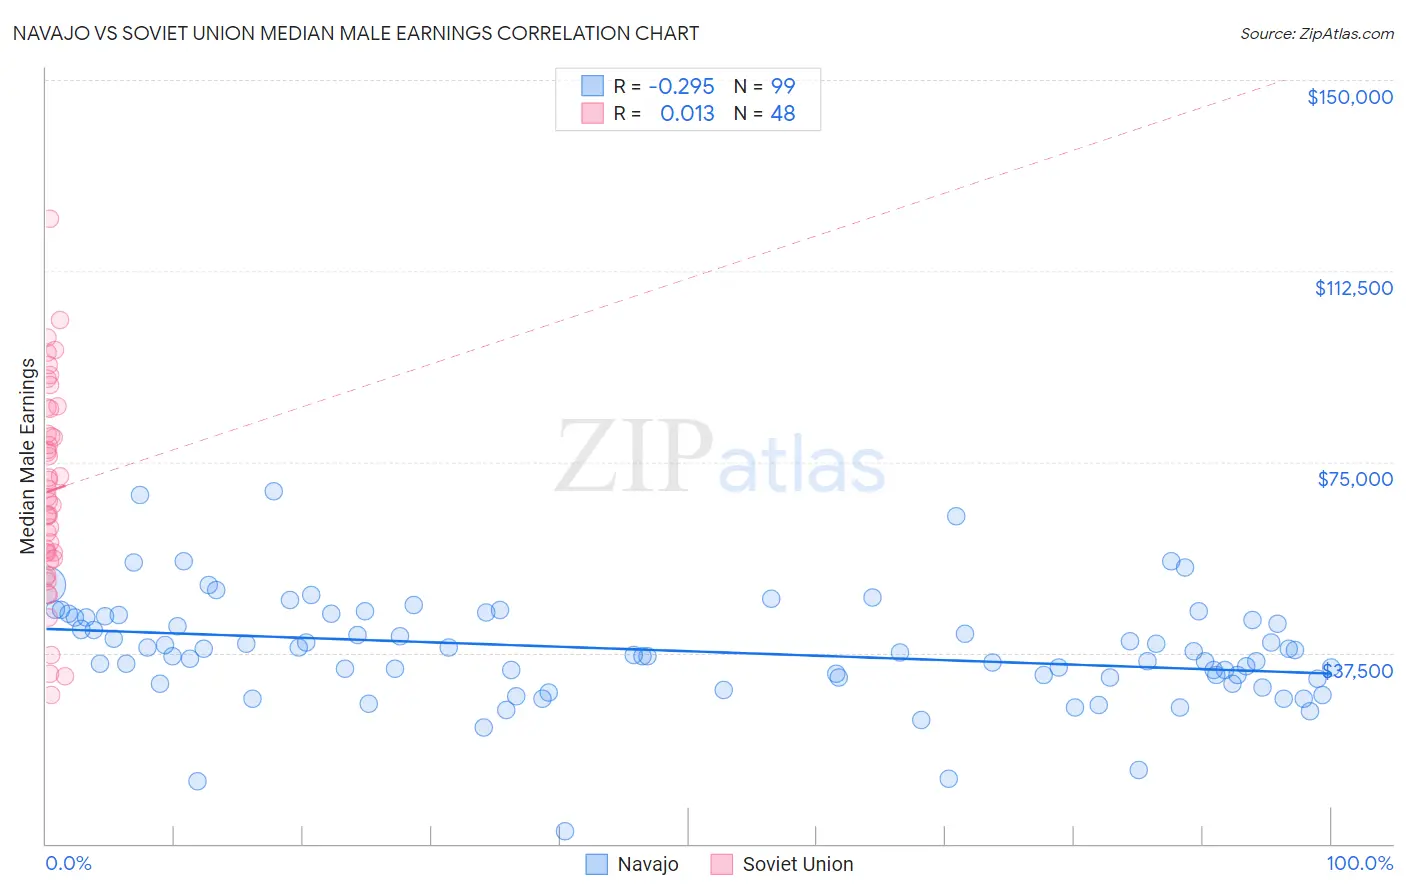
Navajo vs Soviet Union Median Male Earnings Correlation Chart
The statistical analysis conducted on geographies consisting of 224,788,234 people shows a weak negative correlation between the proportion of Navajo and median male earnings in the United States with a correlation coefficient (R) of -0.295 and weighted average of $42,098. Similarly, the statistical analysis conducted on geographies consisting of 43,507,869 people shows no correlation between the proportion of Soviet Union and median male earnings in the United States with a correlation coefficient (R) of 0.013 and weighted average of $63,382, a difference of 50.6%.
Median Male Earnings Correlation Summary
| Measurement | Navajo | Soviet Union |
| Minimum | $2,499 | $29,197 |
| Maximum | $69,181 | $122,813 |
| Range | $66,682 | $93,616 |
| Mean | $37,941 | $69,321 |
| Median | $37,586 | $67,564 |
| Interquartile 25% (IQ1) | $32,558 | $56,498 |
| Interquartile 75% (IQ3) | $44,589 | $82,953 |
| Interquartile Range (IQR) | $12,031 | $26,455 |
| Standard Deviation (Sample) | $10,577 | $19,957 |
| Standard Deviation (Population) | $10,524 | $19,748 |
Similar Demographics by Median Male Earnings
Demographics Similar to Navajo by Median Male Earnings
In terms of median male earnings, the demographic groups most similar to Navajo are Hopi ($42,060, a difference of 0.090%), Pima ($42,357, a difference of 0.62%), Crow ($42,434, a difference of 0.80%), Arapaho ($41,758, a difference of 0.81%), and Lumbee ($41,715, a difference of 0.92%).
| Demographics | Rating | Rank | Median Male Earnings |
| Immigrants | Congo | 0.0 /100 | #333 | Tragic $44,204 |
| Immigrants | Yemen | 0.0 /100 | #334 | Tragic $44,083 |
| Spanish American Indians | 0.0 /100 | #335 | Tragic $44,010 |
| Immigrants | Cuba | 0.0 /100 | #336 | Tragic $43,461 |
| Menominee | 0.0 /100 | #337 | Tragic $42,581 |
| Crow | 0.0 /100 | #338 | Tragic $42,434 |
| Pima | 0.0 /100 | #339 | Tragic $42,357 |
| Navajo | 0.0 /100 | #340 | Tragic $42,098 |
| Hopi | 0.0 /100 | #341 | Tragic $42,060 |
| Arapaho | 0.0 /100 | #342 | Tragic $41,758 |
| Lumbee | 0.0 /100 | #343 | Tragic $41,715 |
| Pueblo | 0.0 /100 | #344 | Tragic $41,314 |
| Puerto Ricans | 0.0 /100 | #345 | Tragic $40,071 |
| Tohono O'odham | 0.0 /100 | #346 | Tragic $39,543 |
| Yup'ik | 0.0 /100 | #347 | Tragic $39,504 |
Demographics Similar to Soviet Union by Median Male Earnings
In terms of median male earnings, the demographic groups most similar to Soviet Union are Immigrants from Lithuania ($63,346, a difference of 0.060%), Immigrants from Russia ($63,326, a difference of 0.090%), Latvian ($63,498, a difference of 0.18%), Immigrants from Asia ($63,240, a difference of 0.22%), and Israeli ($63,228, a difference of 0.24%).
| Demographics | Rating | Rank | Median Male Earnings |
| Immigrants | Denmark | 100.0 /100 | #25 | Exceptional $64,625 |
| Turks | 100.0 /100 | #26 | Exceptional $64,253 |
| Immigrants | Switzerland | 100.0 /100 | #27 | Exceptional $63,944 |
| Russians | 100.0 /100 | #28 | Exceptional $63,939 |
| Asians | 100.0 /100 | #29 | Exceptional $63,827 |
| Immigrants | France | 100.0 /100 | #30 | Exceptional $63,715 |
| Latvians | 100.0 /100 | #31 | Exceptional $63,498 |
| Soviet Union | 100.0 /100 | #32 | Exceptional $63,382 |
| Immigrants | Lithuania | 100.0 /100 | #33 | Exceptional $63,346 |
| Immigrants | Russia | 100.0 /100 | #34 | Exceptional $63,326 |
| Immigrants | Asia | 100.0 /100 | #35 | Exceptional $63,240 |
| Israelis | 100.0 /100 | #36 | Exceptional $63,228 |
| Immigrants | Sri Lanka | 100.0 /100 | #37 | Exceptional $63,099 |
| Maltese | 100.0 /100 | #38 | Exceptional $62,953 |
| Immigrants | South Africa | 100.0 /100 | #39 | Exceptional $62,899 |