Navajo vs Egyptian Median Male Earnings
COMPARE
Navajo
Egyptian
Median Male Earnings
Median Male Earnings Comparison
Navajo
Egyptians
$42,098
MEDIAN MALE EARNINGS
0.0/ 100
METRIC RATING
340th/ 347
METRIC RANK
$61,095
MEDIAN MALE EARNINGS
99.8/ 100
METRIC RATING
60th/ 347
METRIC RANK
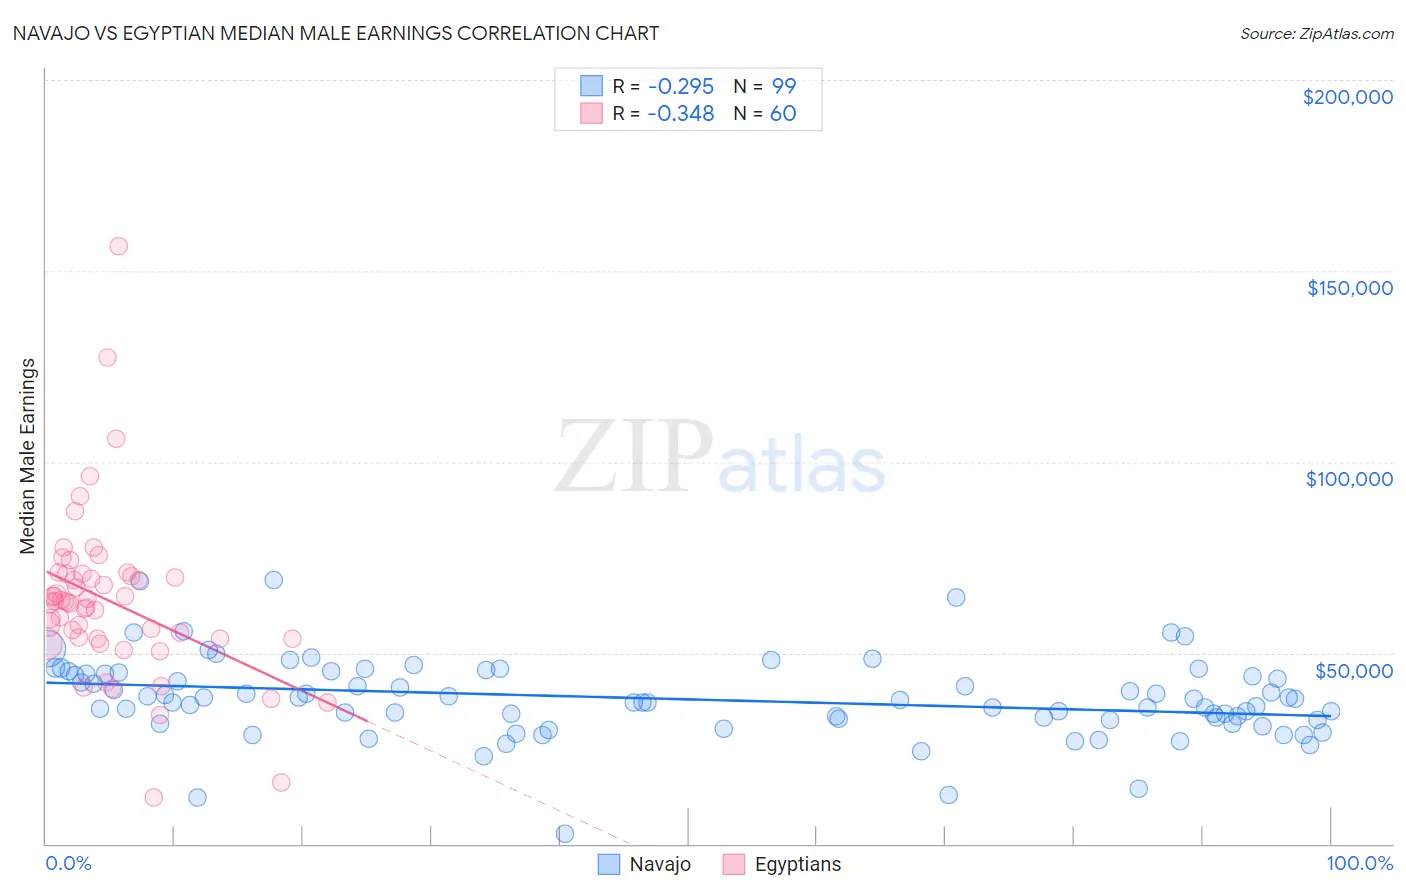
Navajo vs Egyptian Median Male Earnings Correlation Chart
The statistical analysis conducted on geographies consisting of 224,788,234 people shows a weak negative correlation between the proportion of Navajo and median male earnings in the United States with a correlation coefficient (R) of -0.295 and weighted average of $42,098. Similarly, the statistical analysis conducted on geographies consisting of 276,910,194 people shows a mild negative correlation between the proportion of Egyptians and median male earnings in the United States with a correlation coefficient (R) of -0.348 and weighted average of $61,095, a difference of 45.1%.
Median Male Earnings Correlation Summary
| Measurement | Navajo | Egyptian |
| Minimum | $2,499 | $12,000 |
| Maximum | $69,181 | $156,307 |
| Range | $66,682 | $144,307 |
| Mean | $37,941 | $63,667 |
| Median | $37,586 | $63,244 |
| Interquartile 25% (IQ1) | $32,558 | $53,758 |
| Interquartile 75% (IQ3) | $44,589 | $70,255 |
| Interquartile Range (IQR) | $12,031 | $16,497 |
| Standard Deviation (Sample) | $10,577 | $21,981 |
| Standard Deviation (Population) | $10,524 | $21,797 |
Similar Demographics by Median Male Earnings
Demographics Similar to Navajo by Median Male Earnings
In terms of median male earnings, the demographic groups most similar to Navajo are Hopi ($42,060, a difference of 0.090%), Pima ($42,357, a difference of 0.62%), Crow ($42,434, a difference of 0.80%), Arapaho ($41,758, a difference of 0.81%), and Lumbee ($41,715, a difference of 0.92%).
| Demographics | Rating | Rank | Median Male Earnings |
| Immigrants | Congo | 0.0 /100 | #333 | Tragic $44,204 |
| Immigrants | Yemen | 0.0 /100 | #334 | Tragic $44,083 |
| Spanish American Indians | 0.0 /100 | #335 | Tragic $44,010 |
| Immigrants | Cuba | 0.0 /100 | #336 | Tragic $43,461 |
| Menominee | 0.0 /100 | #337 | Tragic $42,581 |
| Crow | 0.0 /100 | #338 | Tragic $42,434 |
| Pima | 0.0 /100 | #339 | Tragic $42,357 |
| Navajo | 0.0 /100 | #340 | Tragic $42,098 |
| Hopi | 0.0 /100 | #341 | Tragic $42,060 |
| Arapaho | 0.0 /100 | #342 | Tragic $41,758 |
| Lumbee | 0.0 /100 | #343 | Tragic $41,715 |
| Pueblo | 0.0 /100 | #344 | Tragic $41,314 |
| Puerto Ricans | 0.0 /100 | #345 | Tragic $40,071 |
| Tohono O'odham | 0.0 /100 | #346 | Tragic $39,543 |
| Yup'ik | 0.0 /100 | #347 | Tragic $39,504 |
Demographics Similar to Egyptians by Median Male Earnings
In terms of median male earnings, the demographic groups most similar to Egyptians are Immigrants from Netherlands ($61,096, a difference of 0.0%), Bolivian ($61,066, a difference of 0.050%), Immigrants from Romania ($61,040, a difference of 0.090%), New Zealander ($61,199, a difference of 0.17%), and Immigrants from Pakistan ($60,987, a difference of 0.18%).
| Demographics | Rating | Rank | Median Male Earnings |
| South Africans | 99.9 /100 | #53 | Exceptional $61,460 |
| Immigrants | Latvia | 99.9 /100 | #54 | Exceptional $61,422 |
| Greeks | 99.9 /100 | #55 | Exceptional $61,242 |
| Lithuanians | 99.9 /100 | #56 | Exceptional $61,228 |
| Immigrants | Scotland | 99.9 /100 | #57 | Exceptional $61,220 |
| New Zealanders | 99.9 /100 | #58 | Exceptional $61,199 |
| Immigrants | Netherlands | 99.8 /100 | #59 | Exceptional $61,096 |
| Egyptians | 99.8 /100 | #60 | Exceptional $61,095 |
| Bolivians | 99.8 /100 | #61 | Exceptional $61,066 |
| Immigrants | Romania | 99.8 /100 | #62 | Exceptional $61,040 |
| Immigrants | Pakistan | 99.8 /100 | #63 | Exceptional $60,987 |
| Immigrants | Eastern Europe | 99.8 /100 | #64 | Exceptional $60,958 |
| Immigrants | Indonesia | 99.8 /100 | #65 | Exceptional $60,935 |
| Immigrants | Croatia | 99.8 /100 | #66 | Exceptional $60,914 |
| Immigrants | Spain | 99.8 /100 | #67 | Exceptional $60,750 |