Navajo vs Carpatho Rusyn Median Male Earnings
COMPARE
Navajo
Carpatho Rusyn
Median Male Earnings
Median Male Earnings Comparison
Navajo
Carpatho Rusyns
$42,098
MEDIAN MALE EARNINGS
0.0/ 100
METRIC RATING
340th/ 347
METRIC RANK
$57,572
MEDIAN MALE EARNINGS
95.3/ 100
METRIC RATING
113th/ 347
METRIC RANK
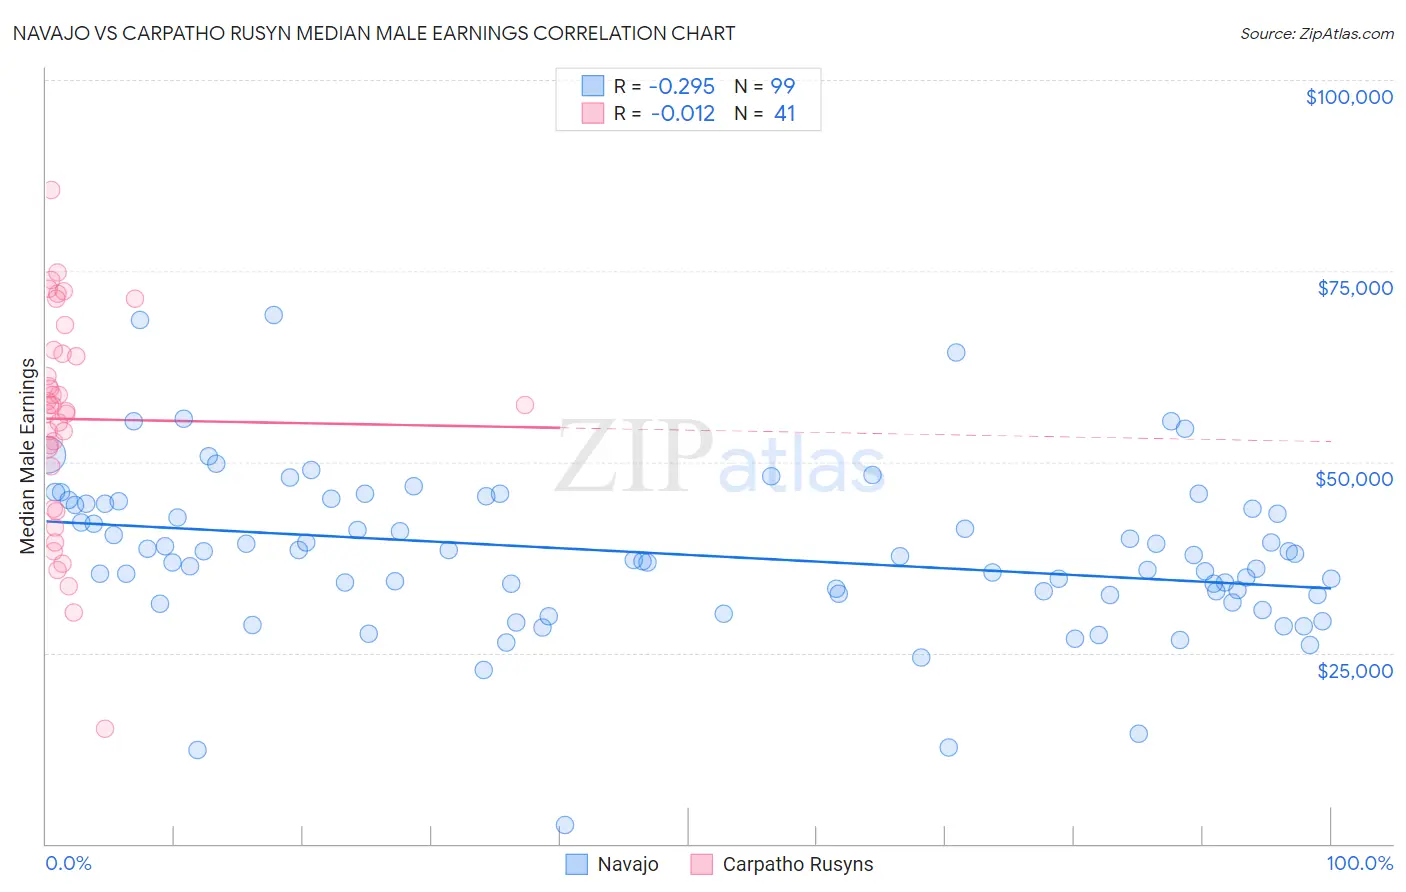
Navajo vs Carpatho Rusyn Median Male Earnings Correlation Chart
The statistical analysis conducted on geographies consisting of 224,788,234 people shows a weak negative correlation between the proportion of Navajo and median male earnings in the United States with a correlation coefficient (R) of -0.295 and weighted average of $42,098. Similarly, the statistical analysis conducted on geographies consisting of 58,862,900 people shows no correlation between the proportion of Carpatho Rusyns and median male earnings in the United States with a correlation coefficient (R) of -0.012 and weighted average of $57,572, a difference of 36.8%.
Median Male Earnings Correlation Summary
| Measurement | Navajo | Carpatho Rusyn |
| Minimum | $2,499 | $15,000 |
| Maximum | $69,181 | $85,583 |
| Range | $66,682 | $70,583 |
| Mean | $37,941 | $55,604 |
| Median | $37,586 | $57,395 |
| Interquartile 25% (IQ1) | $32,558 | $46,688 |
| Interquartile 75% (IQ3) | $44,589 | $64,386 |
| Interquartile Range (IQR) | $12,031 | $17,699 |
| Standard Deviation (Sample) | $10,577 | $14,187 |
| Standard Deviation (Population) | $10,524 | $14,013 |
Similar Demographics by Median Male Earnings
Demographics Similar to Navajo by Median Male Earnings
In terms of median male earnings, the demographic groups most similar to Navajo are Hopi ($42,060, a difference of 0.090%), Pima ($42,357, a difference of 0.62%), Crow ($42,434, a difference of 0.80%), Arapaho ($41,758, a difference of 0.81%), and Lumbee ($41,715, a difference of 0.92%).
| Demographics | Rating | Rank | Median Male Earnings |
| Immigrants | Congo | 0.0 /100 | #333 | Tragic $44,204 |
| Immigrants | Yemen | 0.0 /100 | #334 | Tragic $44,083 |
| Spanish American Indians | 0.0 /100 | #335 | Tragic $44,010 |
| Immigrants | Cuba | 0.0 /100 | #336 | Tragic $43,461 |
| Menominee | 0.0 /100 | #337 | Tragic $42,581 |
| Crow | 0.0 /100 | #338 | Tragic $42,434 |
| Pima | 0.0 /100 | #339 | Tragic $42,357 |
| Navajo | 0.0 /100 | #340 | Tragic $42,098 |
| Hopi | 0.0 /100 | #341 | Tragic $42,060 |
| Arapaho | 0.0 /100 | #342 | Tragic $41,758 |
| Lumbee | 0.0 /100 | #343 | Tragic $41,715 |
| Pueblo | 0.0 /100 | #344 | Tragic $41,314 |
| Puerto Ricans | 0.0 /100 | #345 | Tragic $40,071 |
| Tohono O'odham | 0.0 /100 | #346 | Tragic $39,543 |
| Yup'ik | 0.0 /100 | #347 | Tragic $39,504 |
Demographics Similar to Carpatho Rusyns by Median Male Earnings
In terms of median male earnings, the demographic groups most similar to Carpatho Rusyns are Immigrants from Afghanistan ($57,582, a difference of 0.020%), Immigrants from Kuwait ($57,562, a difference of 0.020%), European ($57,637, a difference of 0.11%), Swedish ($57,445, a difference of 0.22%), and Lebanese ($57,409, a difference of 0.28%).
| Demographics | Rating | Rank | Median Male Earnings |
| Immigrants | Northern Africa | 96.9 /100 | #106 | Exceptional $58,008 |
| Serbians | 96.8 /100 | #107 | Exceptional $57,975 |
| Immigrants | Uzbekistan | 96.7 /100 | #108 | Exceptional $57,941 |
| British | 96.5 /100 | #109 | Exceptional $57,890 |
| Palestinians | 96.2 /100 | #110 | Exceptional $57,778 |
| Europeans | 95.6 /100 | #111 | Exceptional $57,637 |
| Immigrants | Afghanistan | 95.4 /100 | #112 | Exceptional $57,582 |
| Carpatho Rusyns | 95.3 /100 | #113 | Exceptional $57,572 |
| Immigrants | Kuwait | 95.3 /100 | #114 | Exceptional $57,562 |
| Swedes | 94.8 /100 | #115 | Exceptional $57,445 |
| Lebanese | 94.6 /100 | #116 | Exceptional $57,409 |
| Immigrants | Zimbabwe | 94.3 /100 | #117 | Exceptional $57,352 |
| Hungarians | 94.0 /100 | #118 | Exceptional $57,309 |
| Arabs | 94.0 /100 | #119 | Exceptional $57,298 |
| Canadians | 93.9 /100 | #120 | Exceptional $57,286 |