Navajo vs Immigrants from Micronesia Median Male Earnings
COMPARE
Navajo
Immigrants from Micronesia
Median Male Earnings
Median Male Earnings Comparison
Navajo
Immigrants from Micronesia
$42,098
MEDIAN MALE EARNINGS
0.0/ 100
METRIC RATING
340th/ 347
METRIC RANK
$47,177
MEDIAN MALE EARNINGS
0.1/ 100
METRIC RATING
298th/ 347
METRIC RANK
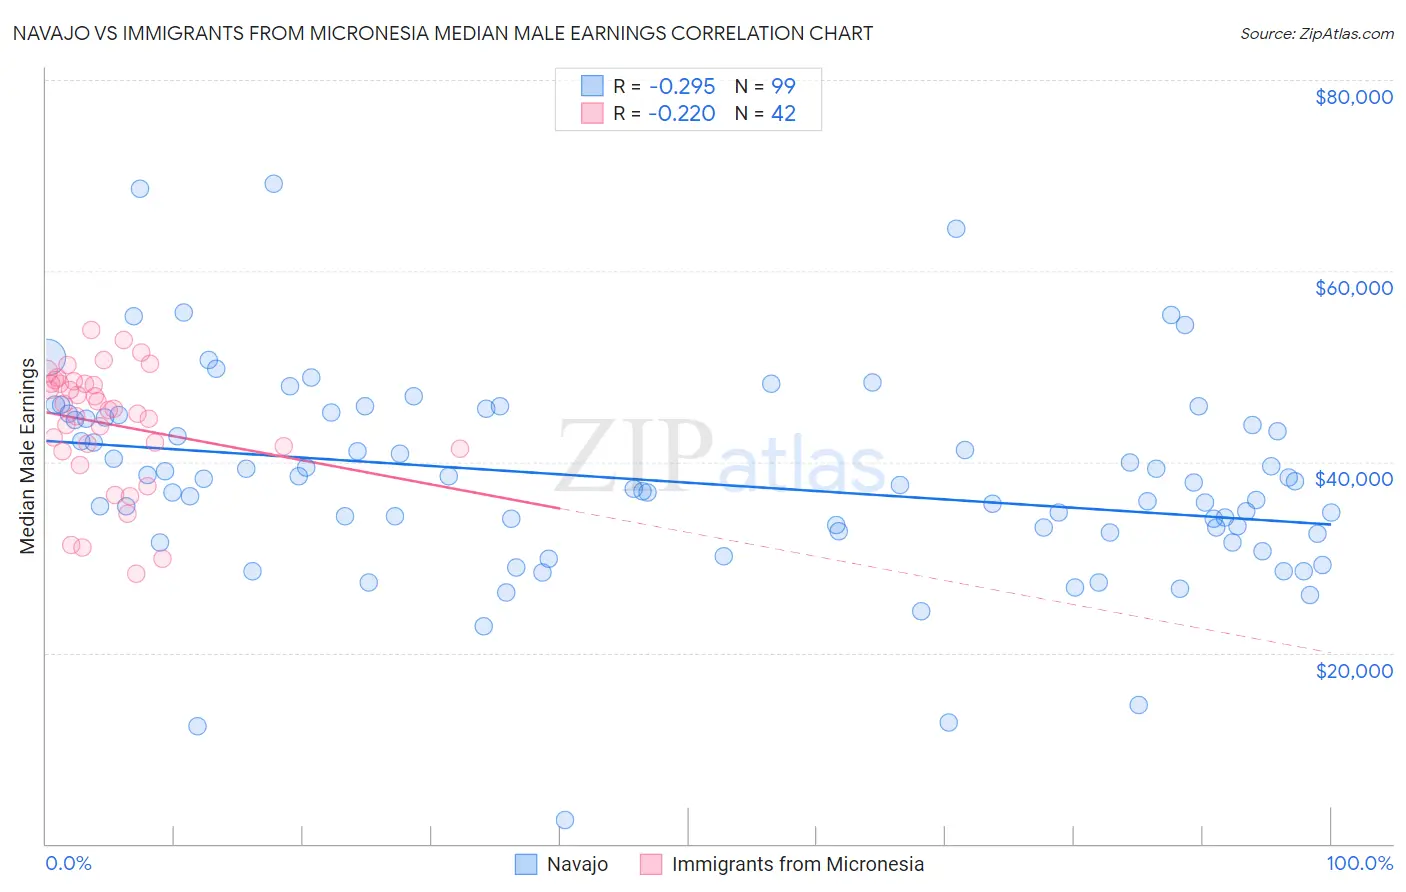
Navajo vs Immigrants from Micronesia Median Male Earnings Correlation Chart
The statistical analysis conducted on geographies consisting of 224,788,234 people shows a weak negative correlation between the proportion of Navajo and median male earnings in the United States with a correlation coefficient (R) of -0.295 and weighted average of $42,098. Similarly, the statistical analysis conducted on geographies consisting of 61,605,252 people shows a weak negative correlation between the proportion of Immigrants from Micronesia and median male earnings in the United States with a correlation coefficient (R) of -0.220 and weighted average of $47,177, a difference of 12.1%.
Median Male Earnings Correlation Summary
| Measurement | Navajo | Immigrants from Micronesia |
| Minimum | $2,499 | $28,299 |
| Maximum | $69,181 | $53,866 |
| Range | $66,682 | $25,567 |
| Mean | $37,941 | $43,968 |
| Median | $37,586 | $45,525 |
| Interquartile 25% (IQ1) | $32,558 | $41,333 |
| Interquartile 75% (IQ3) | $44,589 | $48,203 |
| Interquartile Range (IQR) | $12,031 | $6,870 |
| Standard Deviation (Sample) | $10,577 | $6,332 |
| Standard Deviation (Population) | $10,524 | $6,257 |
Similar Demographics by Median Male Earnings
Demographics Similar to Navajo by Median Male Earnings
In terms of median male earnings, the demographic groups most similar to Navajo are Hopi ($42,060, a difference of 0.090%), Pima ($42,357, a difference of 0.62%), Crow ($42,434, a difference of 0.80%), Arapaho ($41,758, a difference of 0.81%), and Lumbee ($41,715, a difference of 0.92%).
| Demographics | Rating | Rank | Median Male Earnings |
| Immigrants | Congo | 0.0 /100 | #333 | Tragic $44,204 |
| Immigrants | Yemen | 0.0 /100 | #334 | Tragic $44,083 |
| Spanish American Indians | 0.0 /100 | #335 | Tragic $44,010 |
| Immigrants | Cuba | 0.0 /100 | #336 | Tragic $43,461 |
| Menominee | 0.0 /100 | #337 | Tragic $42,581 |
| Crow | 0.0 /100 | #338 | Tragic $42,434 |
| Pima | 0.0 /100 | #339 | Tragic $42,357 |
| Navajo | 0.0 /100 | #340 | Tragic $42,098 |
| Hopi | 0.0 /100 | #341 | Tragic $42,060 |
| Arapaho | 0.0 /100 | #342 | Tragic $41,758 |
| Lumbee | 0.0 /100 | #343 | Tragic $41,715 |
| Pueblo | 0.0 /100 | #344 | Tragic $41,314 |
| Puerto Ricans | 0.0 /100 | #345 | Tragic $40,071 |
| Tohono O'odham | 0.0 /100 | #346 | Tragic $39,543 |
| Yup'ik | 0.0 /100 | #347 | Tragic $39,504 |
Demographics Similar to Immigrants from Micronesia by Median Male Earnings
In terms of median male earnings, the demographic groups most similar to Immigrants from Micronesia are Dominican ($47,204, a difference of 0.060%), Inupiat ($47,281, a difference of 0.22%), Immigrants from Zaire ($47,070, a difference of 0.23%), U.S. Virgin Islander ($47,066, a difference of 0.23%), and Immigrants from Latin America ($46,941, a difference of 0.50%).
| Demographics | Rating | Rank | Median Male Earnings |
| Choctaw | 0.1 /100 | #291 | Tragic $47,729 |
| Immigrants | Dominica | 0.1 /100 | #292 | Tragic $47,651 |
| Indonesians | 0.1 /100 | #293 | Tragic $47,503 |
| Immigrants | Nicaragua | 0.1 /100 | #294 | Tragic $47,482 |
| Central American Indians | 0.1 /100 | #295 | Tragic $47,433 |
| Inupiat | 0.1 /100 | #296 | Tragic $47,281 |
| Dominicans | 0.1 /100 | #297 | Tragic $47,204 |
| Immigrants | Micronesia | 0.1 /100 | #298 | Tragic $47,177 |
| Immigrants | Zaire | 0.1 /100 | #299 | Tragic $47,070 |
| U.S. Virgin Islanders | 0.1 /100 | #300 | Tragic $47,066 |
| Immigrants | Latin America | 0.1 /100 | #301 | Tragic $46,941 |
| Seminole | 0.1 /100 | #302 | Tragic $46,783 |
| Yaqui | 0.1 /100 | #303 | Tragic $46,777 |
| Bangladeshis | 0.1 /100 | #304 | Tragic $46,744 |
| Guatemalans | 0.0 /100 | #305 | Tragic $46,736 |