French Canadian vs Carpatho Rusyn Median Male Earnings
COMPARE
French Canadian
Carpatho Rusyn
Median Male Earnings
Median Male Earnings Comparison
French Canadians
Carpatho Rusyns
$54,722
MEDIAN MALE EARNINGS
55.6/ 100
METRIC RATING
169th/ 347
METRIC RANK
$57,572
MEDIAN MALE EARNINGS
95.3/ 100
METRIC RATING
113th/ 347
METRIC RANK
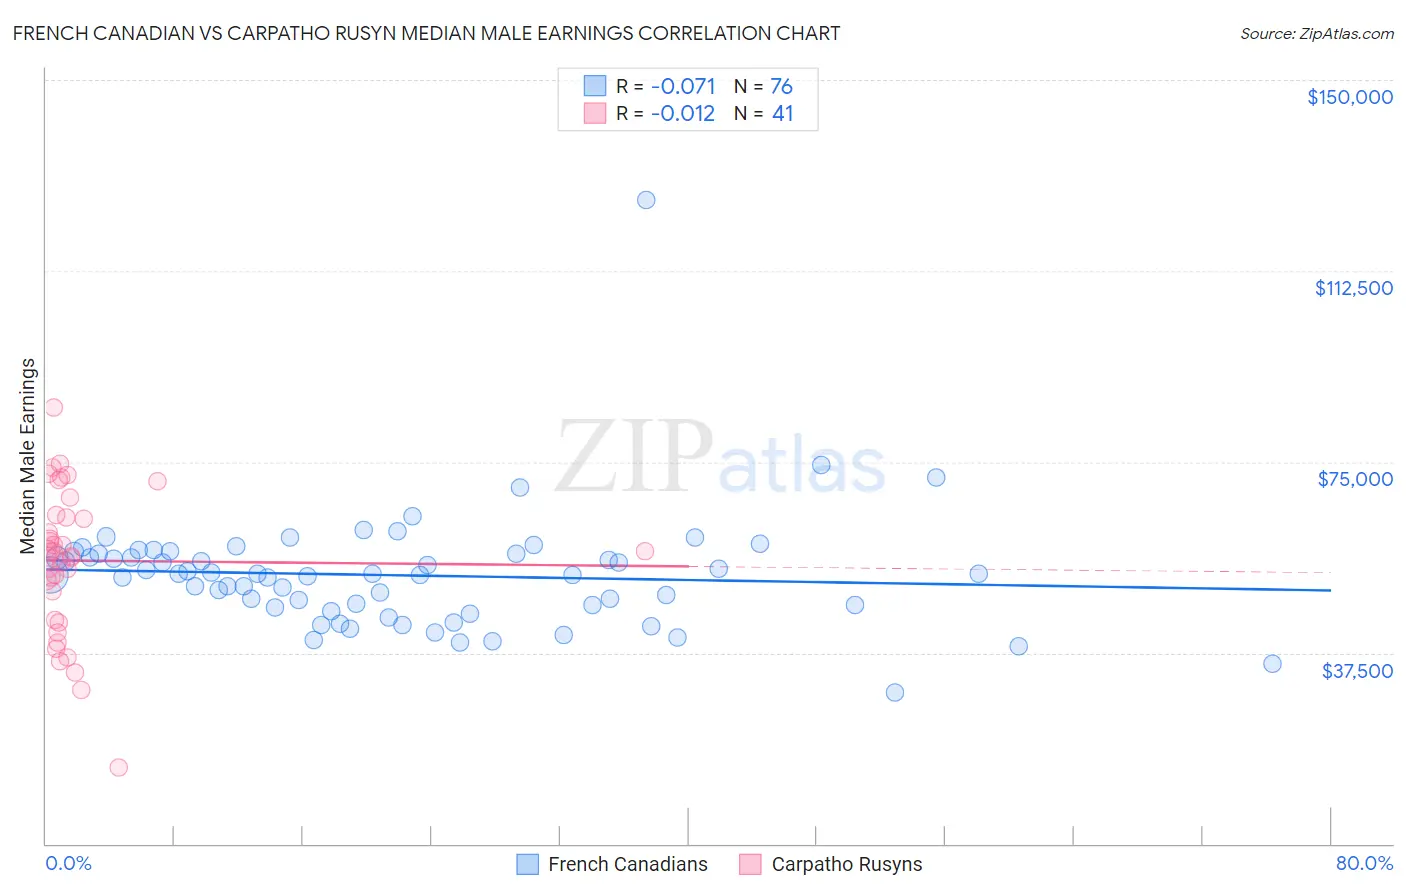
French Canadian vs Carpatho Rusyn Median Male Earnings Correlation Chart
The statistical analysis conducted on geographies consisting of 502,178,853 people shows a slight negative correlation between the proportion of French Canadians and median male earnings in the United States with a correlation coefficient (R) of -0.071 and weighted average of $54,722. Similarly, the statistical analysis conducted on geographies consisting of 58,862,900 people shows no correlation between the proportion of Carpatho Rusyns and median male earnings in the United States with a correlation coefficient (R) of -0.012 and weighted average of $57,572, a difference of 5.2%.
Median Male Earnings Correlation Summary
| Measurement | French Canadian | Carpatho Rusyn |
| Minimum | $29,821 | $15,000 |
| Maximum | $126,333 | $85,583 |
| Range | $96,512 | $70,583 |
| Mean | $52,728 | $55,604 |
| Median | $52,909 | $57,395 |
| Interquartile 25% (IQ1) | $46,602 | $46,688 |
| Interquartile 75% (IQ3) | $56,878 | $64,386 |
| Interquartile Range (IQR) | $10,277 | $17,699 |
| Standard Deviation (Sample) | $11,742 | $14,187 |
| Standard Deviation (Population) | $11,665 | $14,013 |
Similar Demographics by Median Male Earnings
Demographics Similar to French Canadians by Median Male Earnings
In terms of median male earnings, the demographic groups most similar to French Canadians are Finnish ($54,721, a difference of 0.0%), Immigrants from Peru ($54,695, a difference of 0.050%), Welsh ($54,647, a difference of 0.14%), Immigrants from Vietnam ($54,913, a difference of 0.35%), and South American Indian ($54,508, a difference of 0.39%).
| Demographics | Rating | Rank | Median Male Earnings |
| French | 69.9 /100 | #162 | Good $55,350 |
| Ugandans | 68.6 /100 | #163 | Good $55,290 |
| Immigrants | South Eastern Asia | 67.6 /100 | #164 | Good $55,241 |
| Immigrants | Portugal | 66.3 /100 | #165 | Good $55,182 |
| Germans | 61.6 /100 | #166 | Good $54,974 |
| Immigrants | Fiji | 61.2 /100 | #167 | Good $54,958 |
| Immigrants | Vietnam | 60.2 /100 | #168 | Good $54,913 |
| French Canadians | 55.6 /100 | #169 | Average $54,722 |
| Finns | 55.6 /100 | #170 | Average $54,721 |
| Immigrants | Peru | 54.9 /100 | #171 | Average $54,695 |
| Welsh | 53.8 /100 | #172 | Average $54,647 |
| South American Indians | 50.4 /100 | #173 | Average $54,508 |
| South Americans | 50.0 /100 | #174 | Average $54,492 |
| Dutch | 48.0 /100 | #175 | Average $54,410 |
| Spaniards | 47.8 /100 | #176 | Average $54,401 |
Demographics Similar to Carpatho Rusyns by Median Male Earnings
In terms of median male earnings, the demographic groups most similar to Carpatho Rusyns are Immigrants from Afghanistan ($57,582, a difference of 0.020%), Immigrants from Kuwait ($57,562, a difference of 0.020%), European ($57,637, a difference of 0.11%), Swedish ($57,445, a difference of 0.22%), and Lebanese ($57,409, a difference of 0.28%).
| Demographics | Rating | Rank | Median Male Earnings |
| Immigrants | Northern Africa | 96.9 /100 | #106 | Exceptional $58,008 |
| Serbians | 96.8 /100 | #107 | Exceptional $57,975 |
| Immigrants | Uzbekistan | 96.7 /100 | #108 | Exceptional $57,941 |
| British | 96.5 /100 | #109 | Exceptional $57,890 |
| Palestinians | 96.2 /100 | #110 | Exceptional $57,778 |
| Europeans | 95.6 /100 | #111 | Exceptional $57,637 |
| Immigrants | Afghanistan | 95.4 /100 | #112 | Exceptional $57,582 |
| Carpatho Rusyns | 95.3 /100 | #113 | Exceptional $57,572 |
| Immigrants | Kuwait | 95.3 /100 | #114 | Exceptional $57,562 |
| Swedes | 94.8 /100 | #115 | Exceptional $57,445 |
| Lebanese | 94.6 /100 | #116 | Exceptional $57,409 |
| Immigrants | Zimbabwe | 94.3 /100 | #117 | Exceptional $57,352 |
| Hungarians | 94.0 /100 | #118 | Exceptional $57,309 |
| Arabs | 94.0 /100 | #119 | Exceptional $57,298 |
| Canadians | 93.9 /100 | #120 | Exceptional $57,286 |