Native/Alaskan vs Shoshone Median Family Income
COMPARE
Native/Alaskan
Shoshone
Median Family Income
Median Family Income Comparison
Natives/Alaskans
Shoshone
$80,908
MEDIAN FAMILY INCOME
0.0/ 100
METRIC RATING
332nd/ 347
METRIC RANK
$87,872
MEDIAN FAMILY INCOME
0.1/ 100
METRIC RATING
290th/ 347
METRIC RANK
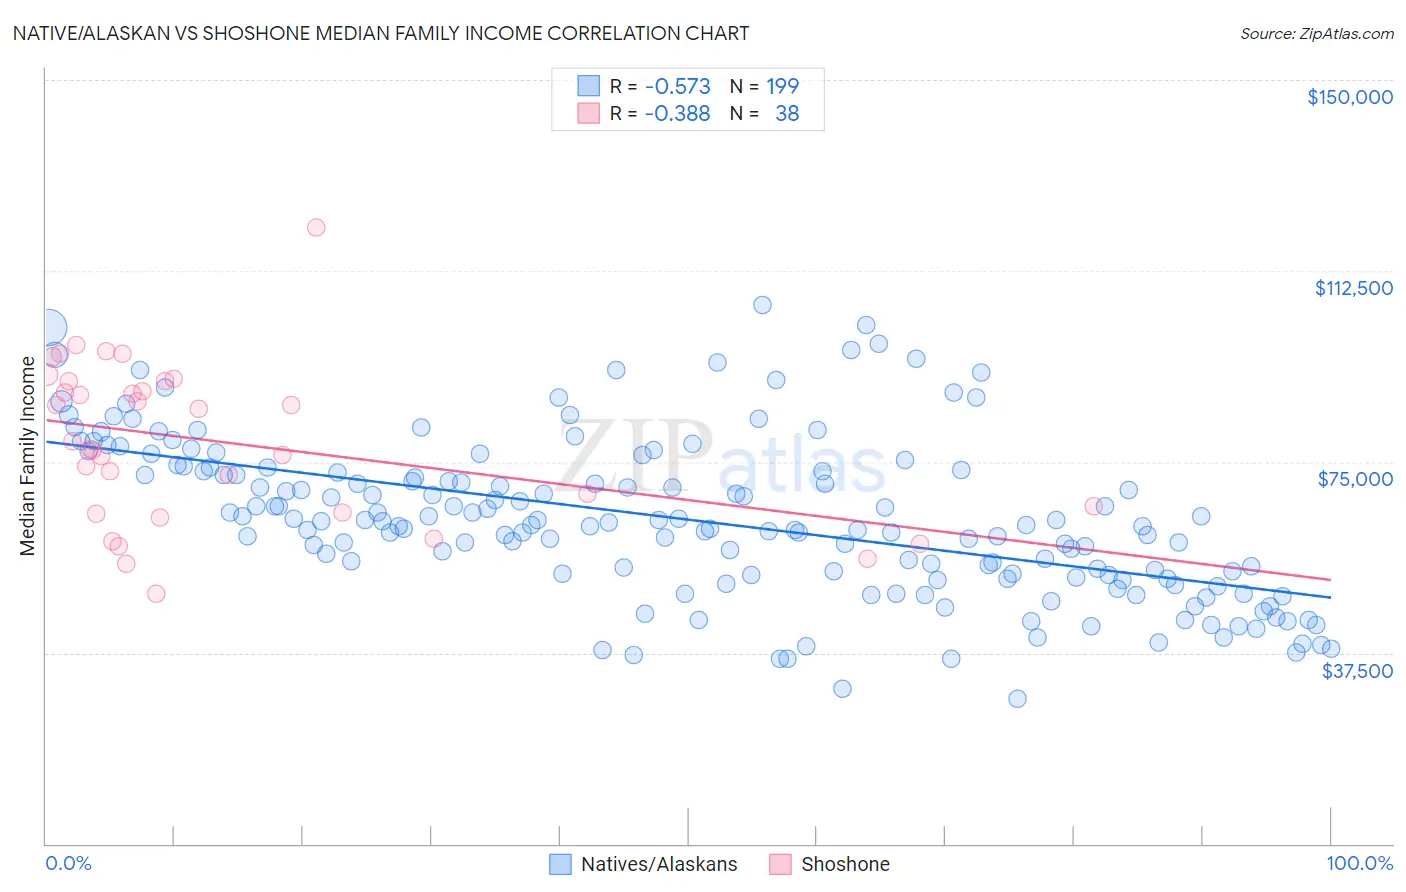
Native/Alaskan vs Shoshone Median Family Income Correlation Chart
The statistical analysis conducted on geographies consisting of 512,223,526 people shows a substantial negative correlation between the proportion of Natives/Alaskans and median family income in the United States with a correlation coefficient (R) of -0.573 and weighted average of $80,908. Similarly, the statistical analysis conducted on geographies consisting of 66,610,248 people shows a mild negative correlation between the proportion of Shoshone and median family income in the United States with a correlation coefficient (R) of -0.388 and weighted average of $87,872, a difference of 8.6%.
Median Family Income Correlation Summary
| Measurement | Native/Alaskan | Shoshone |
| Minimum | $28,542 | $49,050 |
| Maximum | $105,692 | $121,000 |
| Range | $77,150 | $71,950 |
| Mean | $63,631 | $78,936 |
| Median | $62,694 | $78,378 |
| Interquartile 25% (IQ1) | $52,723 | $65,000 |
| Interquartile 75% (IQ3) | $73,193 | $90,917 |
| Interquartile Range (IQR) | $20,470 | $25,917 |
| Standard Deviation (Sample) | $15,516 | $15,660 |
| Standard Deviation (Population) | $15,477 | $15,453 |
Similar Demographics by Median Family Income
Demographics Similar to Natives/Alaskans by Median Family Income
In terms of median family income, the demographic groups most similar to Natives/Alaskans are Kiowa ($80,885, a difference of 0.030%), Immigrants from Dominican Republic ($81,233, a difference of 0.40%), Cheyenne ($81,385, a difference of 0.59%), Dutch West Indian ($81,852, a difference of 1.2%), and Black/African American ($81,912, a difference of 1.2%).
| Demographics | Rating | Rank | Median Family Income |
| Sioux | 0.0 /100 | #325 | Tragic $82,386 |
| Immigrants | Congo | 0.0 /100 | #326 | Tragic $82,216 |
| Arapaho | 0.0 /100 | #327 | Tragic $82,064 |
| Blacks/African Americans | 0.0 /100 | #328 | Tragic $81,912 |
| Dutch West Indians | 0.0 /100 | #329 | Tragic $81,852 |
| Cheyenne | 0.0 /100 | #330 | Tragic $81,385 |
| Immigrants | Dominican Republic | 0.0 /100 | #331 | Tragic $81,233 |
| Natives/Alaskans | 0.0 /100 | #332 | Tragic $80,908 |
| Kiowa | 0.0 /100 | #333 | Tragic $80,885 |
| Menominee | 0.0 /100 | #334 | Tragic $79,563 |
| Yup'ik | 0.0 /100 | #335 | Tragic $79,290 |
| Immigrants | Cuba | 0.0 /100 | #336 | Tragic $78,249 |
| Yuman | 0.0 /100 | #337 | Tragic $78,055 |
| Immigrants | Yemen | 0.0 /100 | #338 | Tragic $77,457 |
| Pima | 0.0 /100 | #339 | Tragic $77,431 |
Demographics Similar to Shoshone by Median Family Income
In terms of median family income, the demographic groups most similar to Shoshone are Immigrants from Cabo Verde ($87,830, a difference of 0.050%), African ($87,820, a difference of 0.060%), Central American Indian ($88,034, a difference of 0.19%), Ute ($87,596, a difference of 0.32%), and Cherokee ($88,209, a difference of 0.38%).
| Demographics | Rating | Rank | Median Family Income |
| Bangladeshis | 0.1 /100 | #283 | Tragic $88,358 |
| Indonesians | 0.1 /100 | #284 | Tragic $88,301 |
| Guatemalans | 0.1 /100 | #285 | Tragic $88,295 |
| Immigrants | Nicaragua | 0.1 /100 | #286 | Tragic $88,267 |
| Potawatomi | 0.1 /100 | #287 | Tragic $88,265 |
| Cherokee | 0.1 /100 | #288 | Tragic $88,209 |
| Central American Indians | 0.1 /100 | #289 | Tragic $88,034 |
| Shoshone | 0.1 /100 | #290 | Tragic $87,872 |
| Immigrants | Cabo Verde | 0.1 /100 | #291 | Tragic $87,830 |
| Africans | 0.1 /100 | #292 | Tragic $87,820 |
| Ute | 0.0 /100 | #293 | Tragic $87,596 |
| Fijians | 0.0 /100 | #294 | Tragic $87,387 |
| Yaqui | 0.0 /100 | #295 | Tragic $87,289 |
| Immigrants | Guatemala | 0.0 /100 | #296 | Tragic $87,191 |
| Cajuns | 0.0 /100 | #297 | Tragic $87,157 |