Native/Alaskan vs Immigrants from Kuwait Median Family Income
COMPARE
Native/Alaskan
Immigrants from Kuwait
Median Family Income
Median Family Income Comparison
Natives/Alaskans
Immigrants from Kuwait
$80,908
MEDIAN FAMILY INCOME
0.0/ 100
METRIC RATING
332nd/ 347
METRIC RANK
$109,731
MEDIAN FAMILY INCOME
97.4/ 100
METRIC RATING
98th/ 347
METRIC RANK
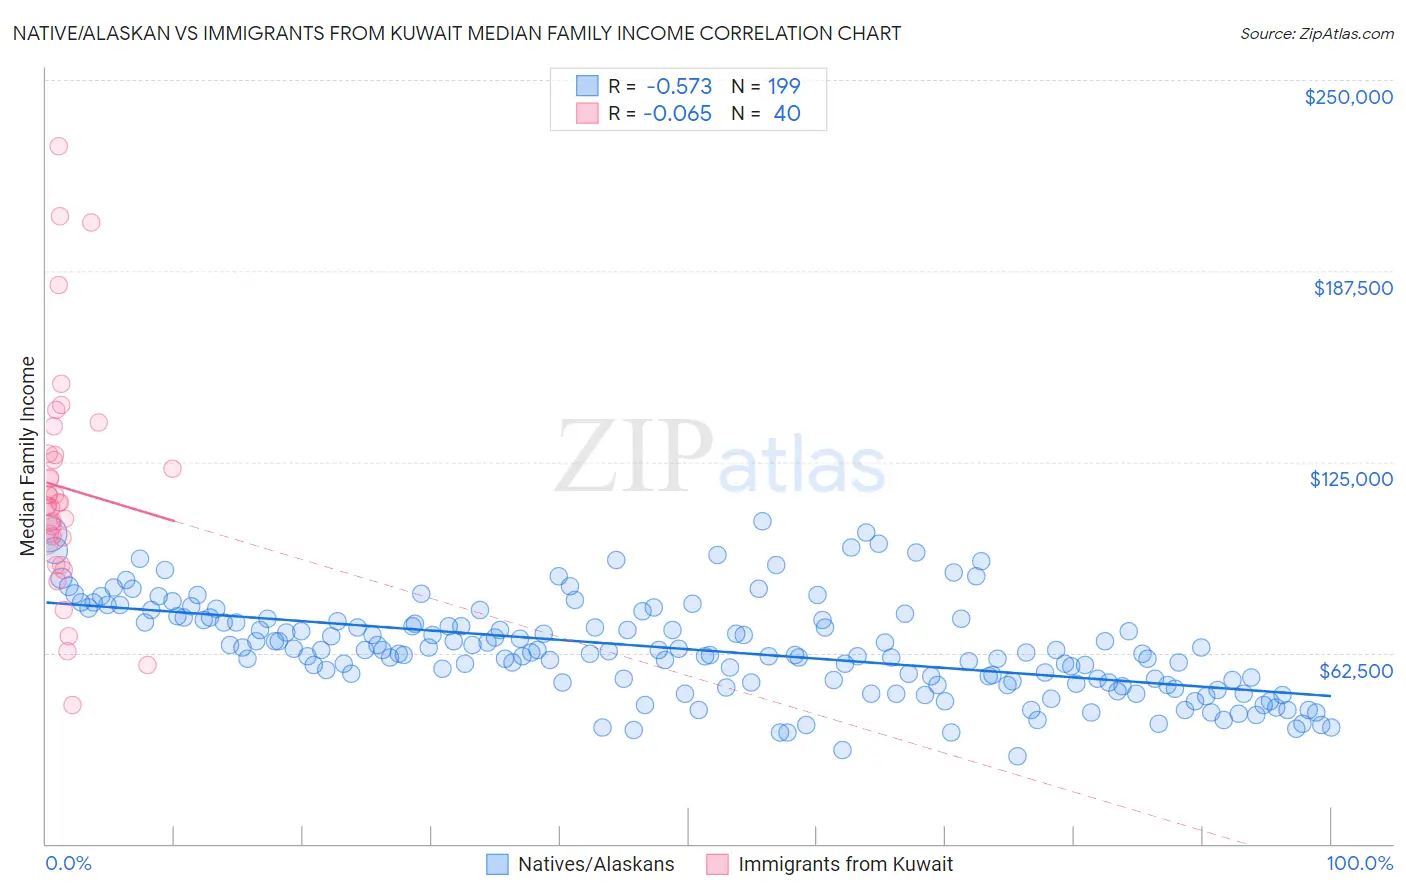
Native/Alaskan vs Immigrants from Kuwait Median Family Income Correlation Chart
The statistical analysis conducted on geographies consisting of 512,223,526 people shows a substantial negative correlation between the proportion of Natives/Alaskans and median family income in the United States with a correlation coefficient (R) of -0.573 and weighted average of $80,908. Similarly, the statistical analysis conducted on geographies consisting of 136,880,543 people shows a slight negative correlation between the proportion of Immigrants from Kuwait and median family income in the United States with a correlation coefficient (R) of -0.065 and weighted average of $109,731, a difference of 35.6%.
Median Family Income Correlation Summary
| Measurement | Native/Alaskan | Immigrants from Kuwait |
| Minimum | $28,542 | $45,469 |
| Maximum | $105,692 | $228,438 |
| Range | $77,150 | $182,969 |
| Mean | $63,631 | $116,543 |
| Median | $62,694 | $111,085 |
| Interquartile 25% (IQ1) | $52,723 | $99,414 |
| Interquartile 75% (IQ3) | $73,193 | $127,464 |
| Interquartile Range (IQR) | $20,470 | $28,050 |
| Standard Deviation (Sample) | $15,516 | $37,905 |
| Standard Deviation (Population) | $15,477 | $37,428 |
Similar Demographics by Median Family Income
Demographics Similar to Natives/Alaskans by Median Family Income
In terms of median family income, the demographic groups most similar to Natives/Alaskans are Kiowa ($80,885, a difference of 0.030%), Immigrants from Dominican Republic ($81,233, a difference of 0.40%), Cheyenne ($81,385, a difference of 0.59%), Dutch West Indian ($81,852, a difference of 1.2%), and Black/African American ($81,912, a difference of 1.2%).
| Demographics | Rating | Rank | Median Family Income |
| Sioux | 0.0 /100 | #325 | Tragic $82,386 |
| Immigrants | Congo | 0.0 /100 | #326 | Tragic $82,216 |
| Arapaho | 0.0 /100 | #327 | Tragic $82,064 |
| Blacks/African Americans | 0.0 /100 | #328 | Tragic $81,912 |
| Dutch West Indians | 0.0 /100 | #329 | Tragic $81,852 |
| Cheyenne | 0.0 /100 | #330 | Tragic $81,385 |
| Immigrants | Dominican Republic | 0.0 /100 | #331 | Tragic $81,233 |
| Natives/Alaskans | 0.0 /100 | #332 | Tragic $80,908 |
| Kiowa | 0.0 /100 | #333 | Tragic $80,885 |
| Menominee | 0.0 /100 | #334 | Tragic $79,563 |
| Yup'ik | 0.0 /100 | #335 | Tragic $79,290 |
| Immigrants | Cuba | 0.0 /100 | #336 | Tragic $78,249 |
| Yuman | 0.0 /100 | #337 | Tragic $78,055 |
| Immigrants | Yemen | 0.0 /100 | #338 | Tragic $77,457 |
| Pima | 0.0 /100 | #339 | Tragic $77,431 |
Demographics Similar to Immigrants from Kuwait by Median Family Income
In terms of median family income, the demographic groups most similar to Immigrants from Kuwait are Armenian ($109,692, a difference of 0.040%), Macedonian ($109,668, a difference of 0.060%), Immigrants from Ukraine ($109,645, a difference of 0.080%), Assyrian/Chaldean/Syriac ($109,622, a difference of 0.10%), and Jordanian ($109,865, a difference of 0.12%).
| Demographics | Rating | Rank | Median Family Income |
| Immigrants | Southern Europe | 98.3 /100 | #91 | Exceptional $110,614 |
| Immigrants | Lebanon | 97.9 /100 | #92 | Exceptional $110,159 |
| Immigrants | Kazakhstan | 97.8 /100 | #93 | Exceptional $110,137 |
| Koreans | 97.8 /100 | #94 | Exceptional $110,103 |
| Zimbabweans | 97.7 /100 | #95 | Exceptional $110,011 |
| Immigrants | Moldova | 97.7 /100 | #96 | Exceptional $109,975 |
| Jordanians | 97.5 /100 | #97 | Exceptional $109,865 |
| Immigrants | Kuwait | 97.4 /100 | #98 | Exceptional $109,731 |
| Armenians | 97.3 /100 | #99 | Exceptional $109,692 |
| Macedonians | 97.3 /100 | #100 | Exceptional $109,668 |
| Immigrants | Ukraine | 97.2 /100 | #101 | Exceptional $109,645 |
| Assyrians/Chaldeans/Syriacs | 97.2 /100 | #102 | Exceptional $109,622 |
| Immigrants | Brazil | 96.9 /100 | #103 | Exceptional $109,418 |
| Palestinians | 96.9 /100 | #104 | Exceptional $109,413 |
| Syrians | 96.7 /100 | #105 | Exceptional $109,299 |