Native/Alaskan vs Immigrants from Bahamas Median Family Income
COMPARE
Native/Alaskan
Immigrants from Bahamas
Median Family Income
Median Family Income Comparison
Natives/Alaskans
Immigrants from Bahamas
$80,908
MEDIAN FAMILY INCOME
0.0/ 100
METRIC RATING
332nd/ 347
METRIC RANK
$84,732
MEDIAN FAMILY INCOME
0.0/ 100
METRIC RATING
314th/ 347
METRIC RANK
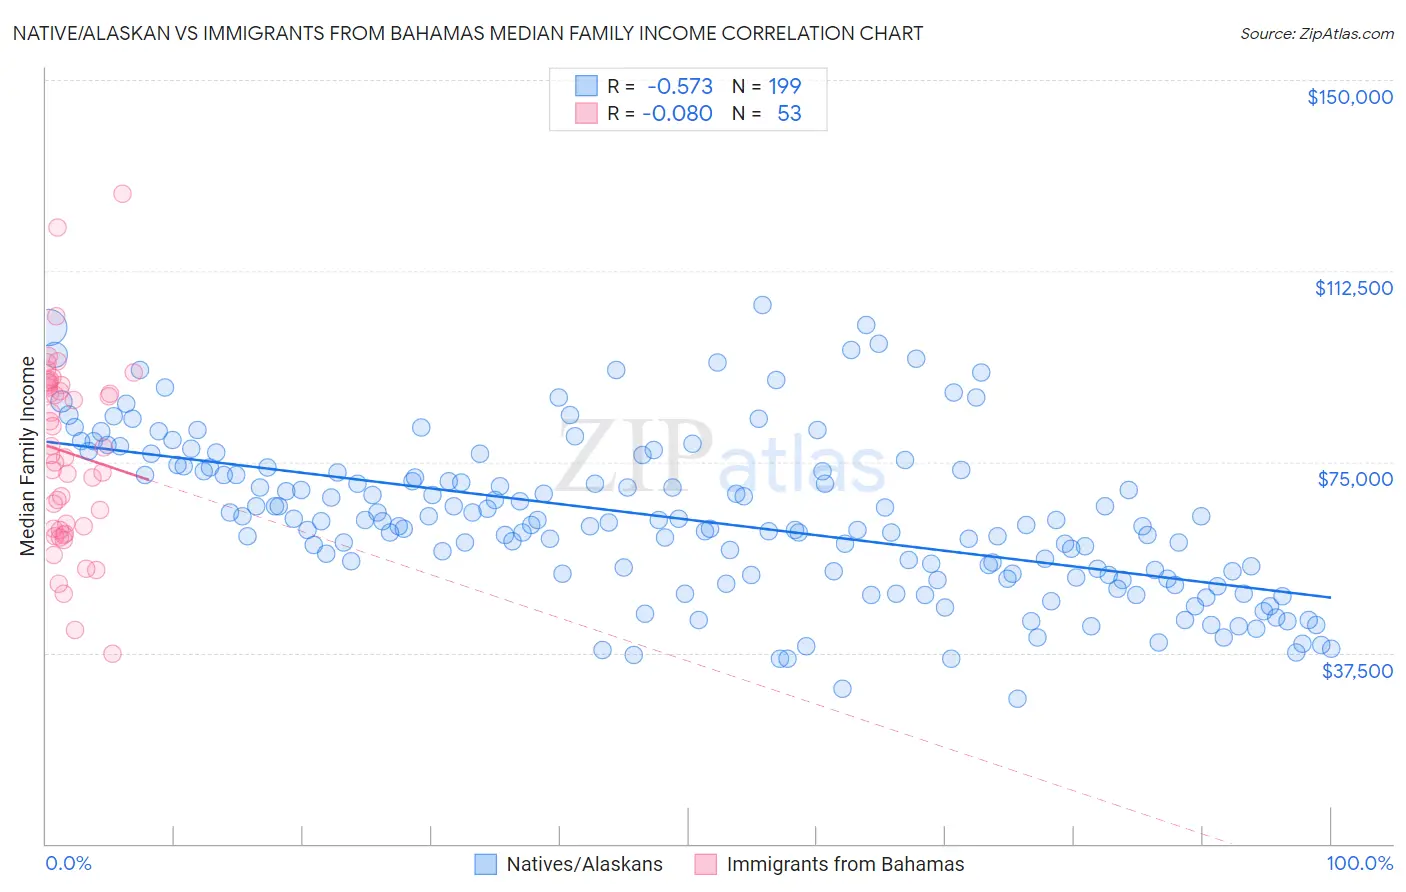
Native/Alaskan vs Immigrants from Bahamas Median Family Income Correlation Chart
The statistical analysis conducted on geographies consisting of 512,223,526 people shows a substantial negative correlation between the proportion of Natives/Alaskans and median family income in the United States with a correlation coefficient (R) of -0.573 and weighted average of $80,908. Similarly, the statistical analysis conducted on geographies consisting of 104,583,914 people shows a slight negative correlation between the proportion of Immigrants from Bahamas and median family income in the United States with a correlation coefficient (R) of -0.080 and weighted average of $84,732, a difference of 4.7%.
Median Family Income Correlation Summary
| Measurement | Native/Alaskan | Immigrants from Bahamas |
| Minimum | $28,542 | $37,231 |
| Maximum | $105,692 | $127,688 |
| Range | $77,150 | $90,457 |
| Mean | $63,631 | $76,834 |
| Median | $62,694 | $76,465 |
| Interquartile 25% (IQ1) | $52,723 | $61,742 |
| Interquartile 75% (IQ3) | $73,193 | $90,302 |
| Interquartile Range (IQR) | $20,470 | $28,560 |
| Standard Deviation (Sample) | $15,516 | $18,260 |
| Standard Deviation (Population) | $15,477 | $18,087 |
Demographics Similar to Natives/Alaskans and Immigrants from Bahamas by Median Family Income
In terms of median family income, the demographic groups most similar to Natives/Alaskans are Kiowa ($80,885, a difference of 0.030%), Immigrants from Dominican Republic ($81,233, a difference of 0.40%), Cheyenne ($81,385, a difference of 0.59%), Dutch West Indian ($81,852, a difference of 1.2%), and Black/African American ($81,912, a difference of 1.2%). Similarly, the demographic groups most similar to Immigrants from Bahamas are Choctaw ($84,835, a difference of 0.12%), Apache ($84,451, a difference of 0.33%), Immigrants from Haiti ($84,018, a difference of 0.85%), Yakama ($83,932, a difference of 0.95%), and Immigrants from Mexico ($83,639, a difference of 1.3%).
| Demographics | Rating | Rank | Median Family Income |
| Choctaw | 0.0 /100 | #313 | Tragic $84,835 |
| Immigrants | Bahamas | 0.0 /100 | #314 | Tragic $84,732 |
| Apache | 0.0 /100 | #315 | Tragic $84,451 |
| Immigrants | Haiti | 0.0 /100 | #316 | Tragic $84,018 |
| Yakama | 0.0 /100 | #317 | Tragic $83,932 |
| Immigrants | Mexico | 0.0 /100 | #318 | Tragic $83,639 |
| Immigrants | Honduras | 0.0 /100 | #319 | Tragic $83,618 |
| Seminole | 0.0 /100 | #320 | Tragic $83,354 |
| Immigrants | Caribbean | 0.0 /100 | #321 | Tragic $83,319 |
| Dominicans | 0.0 /100 | #322 | Tragic $82,888 |
| Bahamians | 0.0 /100 | #323 | Tragic $82,631 |
| Creek | 0.0 /100 | #324 | Tragic $82,560 |
| Sioux | 0.0 /100 | #325 | Tragic $82,386 |
| Immigrants | Congo | 0.0 /100 | #326 | Tragic $82,216 |
| Arapaho | 0.0 /100 | #327 | Tragic $82,064 |
| Blacks/African Americans | 0.0 /100 | #328 | Tragic $81,912 |
| Dutch West Indians | 0.0 /100 | #329 | Tragic $81,852 |
| Cheyenne | 0.0 /100 | #330 | Tragic $81,385 |
| Immigrants | Dominican Republic | 0.0 /100 | #331 | Tragic $81,233 |
| Natives/Alaskans | 0.0 /100 | #332 | Tragic $80,908 |
| Kiowa | 0.0 /100 | #333 | Tragic $80,885 |