Native/Alaskan vs Immigrants from Peru Median Family Income
COMPARE
Native/Alaskan
Immigrants from Peru
Median Family Income
Median Family Income Comparison
Natives/Alaskans
Immigrants from Peru
$80,908
MEDIAN FAMILY INCOME
0.0/ 100
METRIC RATING
332nd/ 347
METRIC RANK
$103,534
MEDIAN FAMILY INCOME
60.8/ 100
METRIC RATING
168th/ 347
METRIC RANK
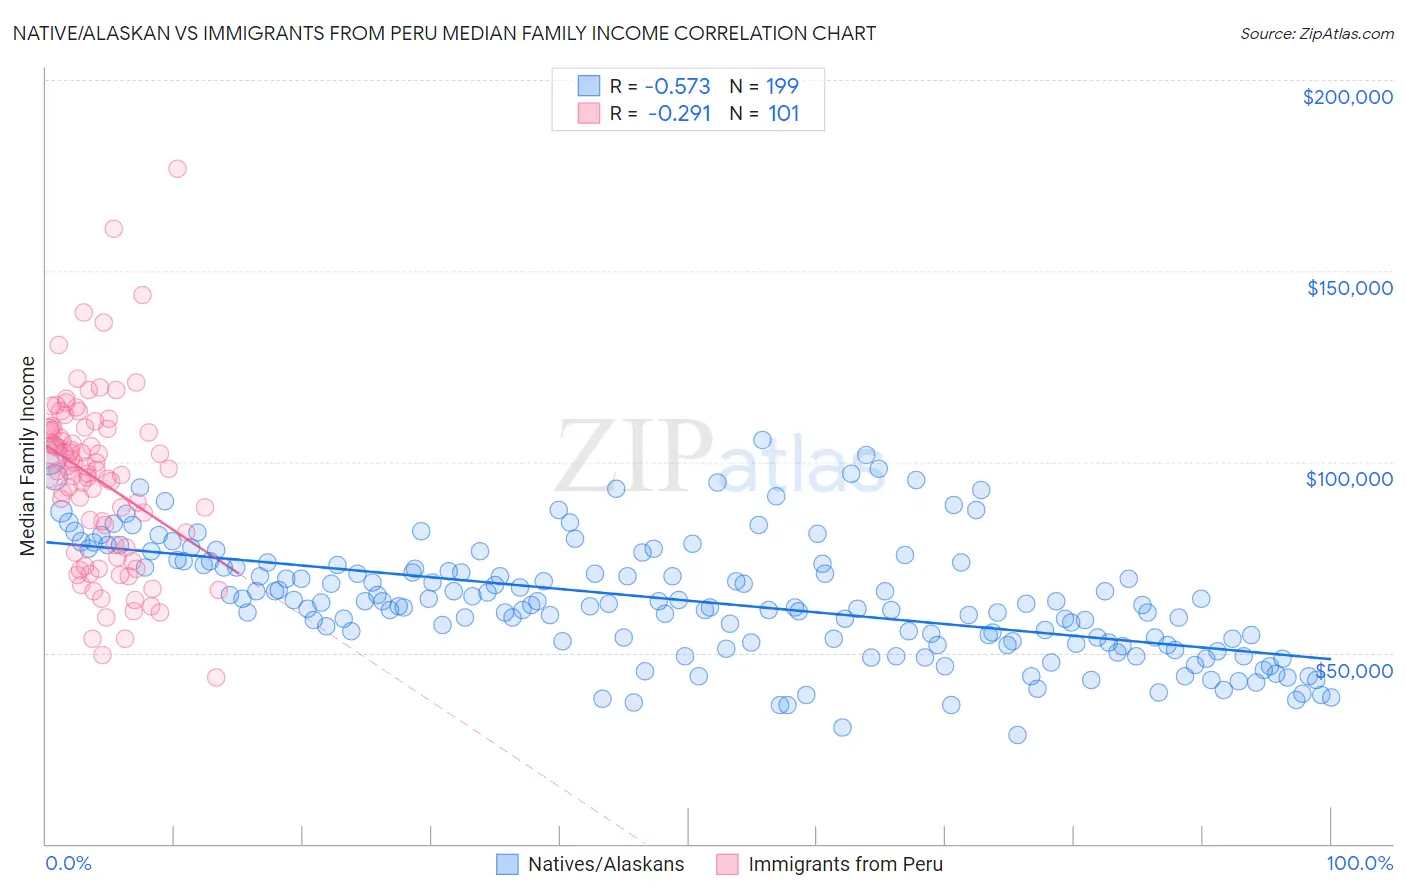
Native/Alaskan vs Immigrants from Peru Median Family Income Correlation Chart
The statistical analysis conducted on geographies consisting of 512,223,526 people shows a substantial negative correlation between the proportion of Natives/Alaskans and median family income in the United States with a correlation coefficient (R) of -0.573 and weighted average of $80,908. Similarly, the statistical analysis conducted on geographies consisting of 328,696,849 people shows a weak negative correlation between the proportion of Immigrants from Peru and median family income in the United States with a correlation coefficient (R) of -0.291 and weighted average of $103,534, a difference of 28.0%.
Median Family Income Correlation Summary
| Measurement | Native/Alaskan | Immigrants from Peru |
| Minimum | $28,542 | $43,482 |
| Maximum | $105,692 | $176,625 |
| Range | $77,150 | $133,143 |
| Mean | $63,631 | $95,423 |
| Median | $62,694 | $98,015 |
| Interquartile 25% (IQ1) | $52,723 | $76,903 |
| Interquartile 75% (IQ3) | $73,193 | $108,609 |
| Interquartile Range (IQR) | $20,470 | $31,706 |
| Standard Deviation (Sample) | $15,516 | $22,960 |
| Standard Deviation (Population) | $15,477 | $22,846 |
Similar Demographics by Median Family Income
Demographics Similar to Natives/Alaskans by Median Family Income
In terms of median family income, the demographic groups most similar to Natives/Alaskans are Kiowa ($80,885, a difference of 0.030%), Immigrants from Dominican Republic ($81,233, a difference of 0.40%), Cheyenne ($81,385, a difference of 0.59%), Dutch West Indian ($81,852, a difference of 1.2%), and Black/African American ($81,912, a difference of 1.2%).
| Demographics | Rating | Rank | Median Family Income |
| Sioux | 0.0 /100 | #325 | Tragic $82,386 |
| Immigrants | Congo | 0.0 /100 | #326 | Tragic $82,216 |
| Arapaho | 0.0 /100 | #327 | Tragic $82,064 |
| Blacks/African Americans | 0.0 /100 | #328 | Tragic $81,912 |
| Dutch West Indians | 0.0 /100 | #329 | Tragic $81,852 |
| Cheyenne | 0.0 /100 | #330 | Tragic $81,385 |
| Immigrants | Dominican Republic | 0.0 /100 | #331 | Tragic $81,233 |
| Natives/Alaskans | 0.0 /100 | #332 | Tragic $80,908 |
| Kiowa | 0.0 /100 | #333 | Tragic $80,885 |
| Menominee | 0.0 /100 | #334 | Tragic $79,563 |
| Yup'ik | 0.0 /100 | #335 | Tragic $79,290 |
| Immigrants | Cuba | 0.0 /100 | #336 | Tragic $78,249 |
| Yuman | 0.0 /100 | #337 | Tragic $78,055 |
| Immigrants | Yemen | 0.0 /100 | #338 | Tragic $77,457 |
| Pima | 0.0 /100 | #339 | Tragic $77,431 |
Demographics Similar to Immigrants from Peru by Median Family Income
In terms of median family income, the demographic groups most similar to Immigrants from Peru are South American Indian ($103,624, a difference of 0.090%), English ($103,684, a difference of 0.15%), Slovak ($103,729, a difference of 0.19%), Czechoslovakian ($103,273, a difference of 0.25%), and Sierra Leonean ($103,859, a difference of 0.31%).
| Demographics | Rating | Rank | Median Family Income |
| Icelanders | 69.4 /100 | #161 | Good $104,282 |
| Immigrants | Sierra Leone | 66.2 /100 | #162 | Good $103,990 |
| Costa Ricans | 66.2 /100 | #163 | Good $103,989 |
| Sierra Leoneans | 64.7 /100 | #164 | Good $103,859 |
| Slovaks | 63.1 /100 | #165 | Good $103,729 |
| English | 62.6 /100 | #166 | Good $103,684 |
| South American Indians | 61.9 /100 | #167 | Good $103,624 |
| Immigrants | Peru | 60.8 /100 | #168 | Good $103,534 |
| Czechoslovakians | 57.6 /100 | #169 | Average $103,273 |
| Immigrants | Uzbekistan | 56.6 /100 | #170 | Average $103,197 |
| Alsatians | 54.3 /100 | #171 | Average $103,010 |
| Immigrants | Eritrea | 51.9 /100 | #172 | Average $102,823 |
| Belgians | 51.4 /100 | #173 | Average $102,788 |
| Finns | 50.0 /100 | #174 | Average $102,676 |
| Immigrants | Eastern Africa | 47.1 /100 | #175 | Average $102,451 |