Ecuadorian vs Shoshone Median Family Income
COMPARE
Ecuadorian
Shoshone
Median Family Income
Median Family Income Comparison
Ecuadorians
Shoshone
$95,114
MEDIAN FAMILY INCOME
2.1/ 100
METRIC RATING
231st/ 347
METRIC RANK
$87,872
MEDIAN FAMILY INCOME
0.1/ 100
METRIC RATING
290th/ 347
METRIC RANK
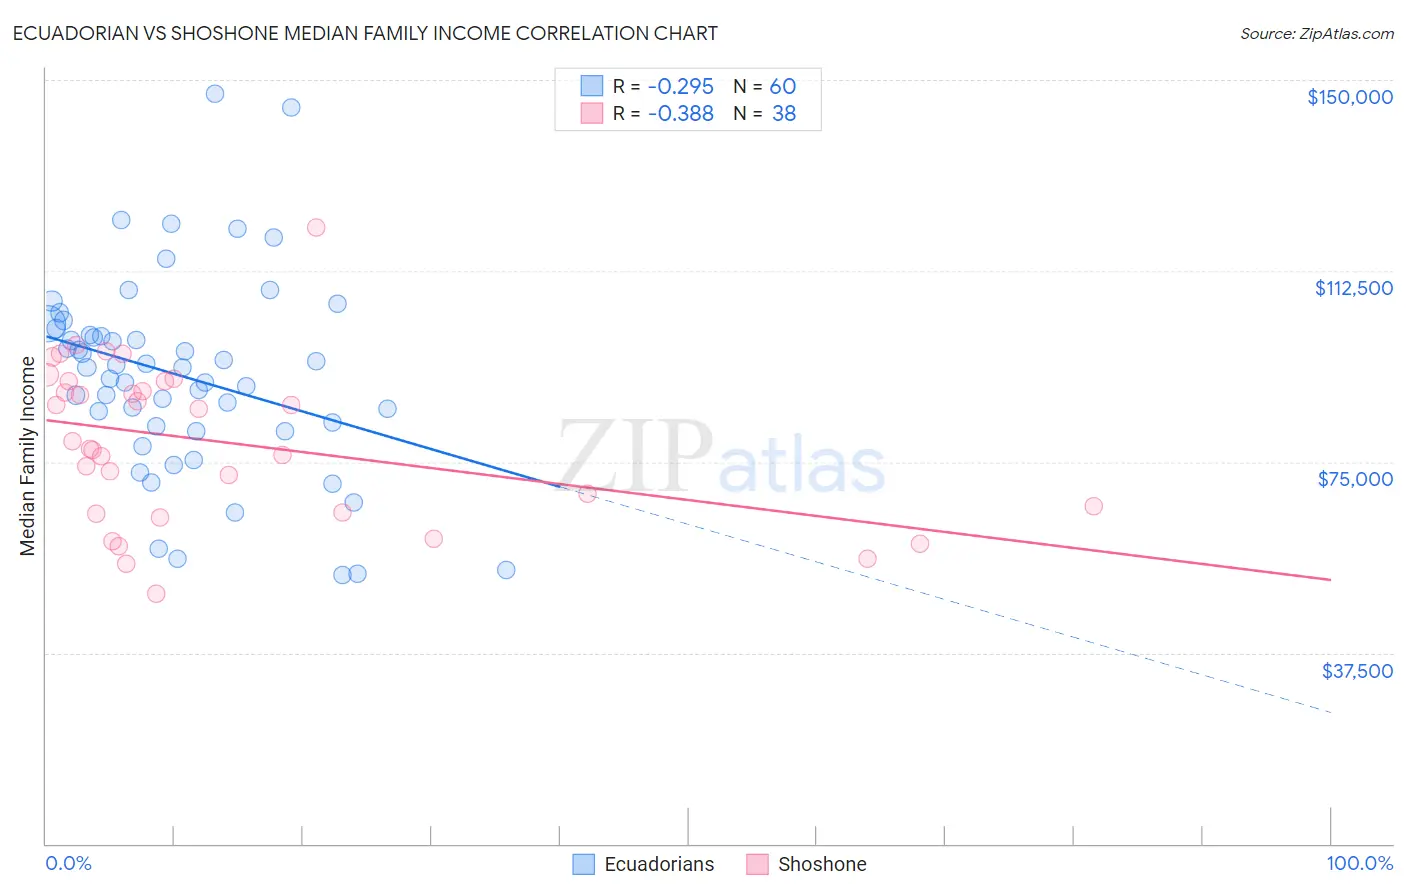
Ecuadorian vs Shoshone Median Family Income Correlation Chart
The statistical analysis conducted on geographies consisting of 317,539,775 people shows a weak negative correlation between the proportion of Ecuadorians and median family income in the United States with a correlation coefficient (R) of -0.295 and weighted average of $95,114. Similarly, the statistical analysis conducted on geographies consisting of 66,610,248 people shows a mild negative correlation between the proportion of Shoshone and median family income in the United States with a correlation coefficient (R) of -0.388 and weighted average of $87,872, a difference of 8.2%.
Median Family Income Correlation Summary
| Measurement | Ecuadorian | Shoshone |
| Minimum | $52,846 | $49,050 |
| Maximum | $147,371 | $121,000 |
| Range | $94,525 | $71,950 |
| Mean | $91,870 | $78,936 |
| Median | $93,530 | $78,378 |
| Interquartile 25% (IQ1) | $81,441 | $65,000 |
| Interquartile 75% (IQ3) | $100,588 | $90,917 |
| Interquartile Range (IQR) | $19,147 | $25,917 |
| Standard Deviation (Sample) | $19,583 | $15,660 |
| Standard Deviation (Population) | $19,420 | $15,453 |
Similar Demographics by Median Family Income
Demographics Similar to Ecuadorians by Median Family Income
In terms of median family income, the demographic groups most similar to Ecuadorians are Malaysian ($95,230, a difference of 0.12%), Marshallese ($95,293, a difference of 0.19%), Immigrants from Venezuela ($94,904, a difference of 0.22%), Immigrants from the Azores ($95,402, a difference of 0.30%), and Immigrants from Bangladesh ($94,665, a difference of 0.47%).
| Demographics | Rating | Rank | Median Family Income |
| Immigrants | Nonimmigrants | 3.6 /100 | #224 | Tragic $96,231 |
| Vietnamese | 3.4 /100 | #225 | Tragic $96,123 |
| Immigrants | Panama | 2.7 /100 | #226 | Tragic $95,647 |
| Alaska Natives | 2.6 /100 | #227 | Tragic $95,573 |
| Immigrants | Azores | 2.4 /100 | #228 | Tragic $95,402 |
| Marshallese | 2.2 /100 | #229 | Tragic $95,293 |
| Malaysians | 2.2 /100 | #230 | Tragic $95,230 |
| Ecuadorians | 2.1 /100 | #231 | Tragic $95,114 |
| Immigrants | Venezuela | 1.9 /100 | #232 | Tragic $94,904 |
| Immigrants | Bangladesh | 1.6 /100 | #233 | Tragic $94,665 |
| Immigrants | Western Africa | 1.6 /100 | #234 | Tragic $94,638 |
| Immigrants | Burma/Myanmar | 1.5 /100 | #235 | Tragic $94,472 |
| Trinidadians and Tobagonians | 1.5 /100 | #236 | Tragic $94,466 |
| Alaskan Athabascans | 1.5 /100 | #237 | Tragic $94,429 |
| Nepalese | 1.3 /100 | #238 | Tragic $94,153 |
Demographics Similar to Shoshone by Median Family Income
In terms of median family income, the demographic groups most similar to Shoshone are Immigrants from Cabo Verde ($87,830, a difference of 0.050%), African ($87,820, a difference of 0.060%), Central American Indian ($88,034, a difference of 0.19%), Ute ($87,596, a difference of 0.32%), and Cherokee ($88,209, a difference of 0.38%).
| Demographics | Rating | Rank | Median Family Income |
| Bangladeshis | 0.1 /100 | #283 | Tragic $88,358 |
| Indonesians | 0.1 /100 | #284 | Tragic $88,301 |
| Guatemalans | 0.1 /100 | #285 | Tragic $88,295 |
| Immigrants | Nicaragua | 0.1 /100 | #286 | Tragic $88,267 |
| Potawatomi | 0.1 /100 | #287 | Tragic $88,265 |
| Cherokee | 0.1 /100 | #288 | Tragic $88,209 |
| Central American Indians | 0.1 /100 | #289 | Tragic $88,034 |
| Shoshone | 0.1 /100 | #290 | Tragic $87,872 |
| Immigrants | Cabo Verde | 0.1 /100 | #291 | Tragic $87,830 |
| Africans | 0.1 /100 | #292 | Tragic $87,820 |
| Ute | 0.0 /100 | #293 | Tragic $87,596 |
| Fijians | 0.0 /100 | #294 | Tragic $87,387 |
| Yaqui | 0.0 /100 | #295 | Tragic $87,289 |
| Immigrants | Guatemala | 0.0 /100 | #296 | Tragic $87,191 |
| Cajuns | 0.0 /100 | #297 | Tragic $87,157 |