Native/Alaskan vs Immigrants from Peru Median Earnings
COMPARE
Native/Alaskan
Immigrants from Peru
Median Earnings
Median Earnings Comparison
Natives/Alaskans
Immigrants from Peru
$38,896
MEDIAN EARNINGS
0.0/ 100
METRIC RATING
335th/ 347
METRIC RANK
$47,025
MEDIAN EARNINGS
69.6/ 100
METRIC RATING
159th/ 347
METRIC RANK
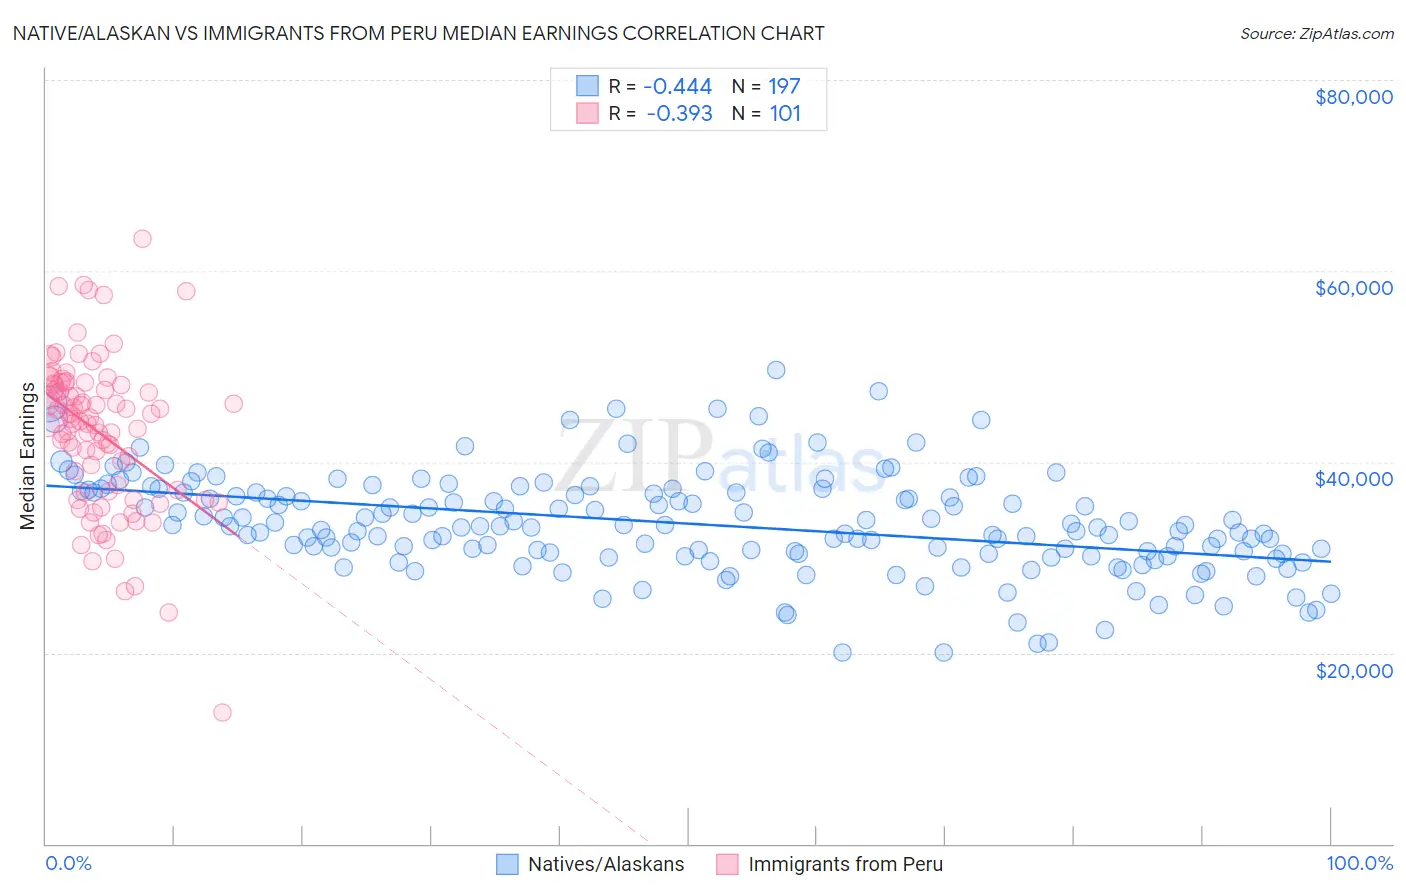
Native/Alaskan vs Immigrants from Peru Median Earnings Correlation Chart
The statistical analysis conducted on geographies consisting of 512,831,083 people shows a moderate negative correlation between the proportion of Natives/Alaskans and median earnings in the United States with a correlation coefficient (R) of -0.444 and weighted average of $38,896. Similarly, the statistical analysis conducted on geographies consisting of 328,851,248 people shows a mild negative correlation between the proportion of Immigrants from Peru and median earnings in the United States with a correlation coefficient (R) of -0.393 and weighted average of $47,025, a difference of 20.9%.
Median Earnings Correlation Summary
| Measurement | Native/Alaskan | Immigrants from Peru |
| Minimum | $20,036 | $13,750 |
| Maximum | $49,581 | $63,387 |
| Range | $29,544 | $49,637 |
| Mean | $33,526 | $43,144 |
| Median | $33,302 | $44,577 |
| Interquartile 25% (IQ1) | $30,416 | $36,980 |
| Interquartile 75% (IQ3) | $36,881 | $48,145 |
| Interquartile Range (IQR) | $6,465 | $11,165 |
| Standard Deviation (Sample) | $5,244 | $8,031 |
| Standard Deviation (Population) | $5,231 | $7,991 |
Similar Demographics by Median Earnings
Demographics Similar to Natives/Alaskans by Median Earnings
In terms of median earnings, the demographic groups most similar to Natives/Alaskans are Spanish American Indian ($38,907, a difference of 0.030%), Houma ($38,949, a difference of 0.14%), Crow ($38,707, a difference of 0.49%), Yakama ($39,107, a difference of 0.54%), and Immigrants from Mexico ($39,114, a difference of 0.56%).
| Demographics | Rating | Rank | Median Earnings |
| Sioux | 0.0 /100 | #328 | Tragic $39,448 |
| Kiowa | 0.0 /100 | #329 | Tragic $39,232 |
| Immigrants | Congo | 0.0 /100 | #330 | Tragic $39,169 |
| Immigrants | Mexico | 0.0 /100 | #331 | Tragic $39,114 |
| Yakama | 0.0 /100 | #332 | Tragic $39,107 |
| Houma | 0.0 /100 | #333 | Tragic $38,949 |
| Spanish American Indians | 0.0 /100 | #334 | Tragic $38,907 |
| Natives/Alaskans | 0.0 /100 | #335 | Tragic $38,896 |
| Crow | 0.0 /100 | #336 | Tragic $38,707 |
| Immigrants | Cuba | 0.0 /100 | #337 | Tragic $38,426 |
| Pima | 0.0 /100 | #338 | Tragic $38,285 |
| Menominee | 0.0 /100 | #339 | Tragic $37,884 |
| Navajo | 0.0 /100 | #340 | Tragic $36,999 |
| Lumbee | 0.0 /100 | #341 | Tragic $36,876 |
| Hopi | 0.0 /100 | #342 | Tragic $36,871 |
Demographics Similar to Immigrants from Peru by Median Earnings
In terms of median earnings, the demographic groups most similar to Immigrants from Peru are Alsatian ($47,023, a difference of 0.0%), Immigrants from Eastern Africa ($46,969, a difference of 0.12%), Slovak ($47,095, a difference of 0.15%), South American Indian ($46,952, a difference of 0.16%), and Icelander ($46,916, a difference of 0.23%).
| Demographics | Rating | Rank | Median Earnings |
| Immigrants | Germany | 83.1 /100 | #152 | Excellent $47,566 |
| Slavs | 81.1 /100 | #153 | Excellent $47,470 |
| Immigrants | Portugal | 77.3 /100 | #154 | Good $47,304 |
| Immigrants | Vietnam | 76.7 /100 | #155 | Good $47,282 |
| Irish | 76.6 /100 | #156 | Good $47,276 |
| Czechs | 75.1 /100 | #157 | Good $47,221 |
| Slovaks | 71.7 /100 | #158 | Good $47,095 |
| Immigrants | Peru | 69.6 /100 | #159 | Good $47,025 |
| Alsatians | 69.6 /100 | #160 | Good $47,023 |
| Immigrants | Eastern Africa | 68.0 /100 | #161 | Good $46,969 |
| South American Indians | 67.4 /100 | #162 | Good $46,952 |
| Icelanders | 66.3 /100 | #163 | Good $46,916 |
| Norwegians | 64.7 /100 | #164 | Good $46,865 |
| South Americans | 62.7 /100 | #165 | Good $46,804 |
| Czechoslovakians | 57.8 /100 | #166 | Average $46,658 |