Korean vs Immigrants from Czechoslovakia Median Male Earnings
COMPARE
Korean
Immigrants from Czechoslovakia
Median Male Earnings
Median Male Earnings Comparison
Koreans
Immigrants from Czechoslovakia
$56,672
MEDIAN MALE EARNINGS
89.4/ 100
METRIC RATING
130th/ 347
METRIC RANK
$62,217
MEDIAN MALE EARNINGS
99.9/ 100
METRIC RATING
46th/ 347
METRIC RANK
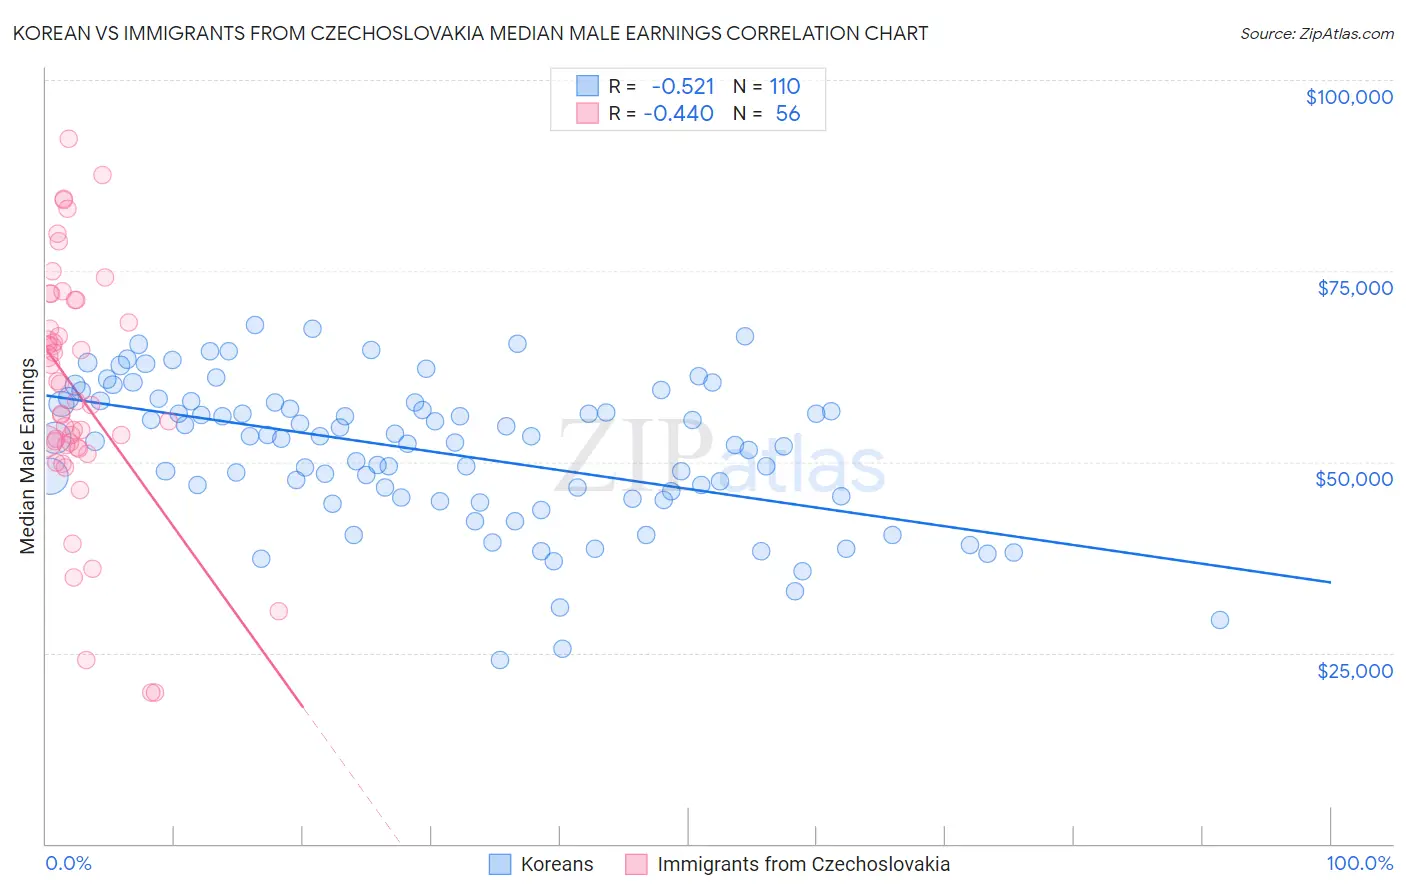
Korean vs Immigrants from Czechoslovakia Median Male Earnings Correlation Chart
The statistical analysis conducted on geographies consisting of 510,664,628 people shows a substantial negative correlation between the proportion of Koreans and median male earnings in the United States with a correlation coefficient (R) of -0.521 and weighted average of $56,672. Similarly, the statistical analysis conducted on geographies consisting of 195,431,341 people shows a moderate negative correlation between the proportion of Immigrants from Czechoslovakia and median male earnings in the United States with a correlation coefficient (R) of -0.440 and weighted average of $62,217, a difference of 9.8%.
Median Male Earnings Correlation Summary
| Measurement | Korean | Immigrants from Czechoslovakia |
| Minimum | $24,028 | $19,792 |
| Maximum | $67,994 | $92,305 |
| Range | $43,966 | $72,513 |
| Mean | $51,299 | $59,087 |
| Median | $53,093 | $57,746 |
| Interquartile 25% (IQ1) | $45,357 | $51,971 |
| Interquartile 75% (IQ3) | $57,742 | $69,695 |
| Interquartile Range (IQR) | $12,385 | $17,724 |
| Standard Deviation (Sample) | $9,399 | $15,934 |
| Standard Deviation (Population) | $9,356 | $15,791 |
Similar Demographics by Median Male Earnings
Demographics Similar to Koreans by Median Male Earnings
In terms of median male earnings, the demographic groups most similar to Koreans are Portuguese ($56,663, a difference of 0.020%), Pakistani ($56,719, a difference of 0.080%), Czech ($56,546, a difference of 0.22%), Immigrants from Germany ($56,542, a difference of 0.23%), and Immigrants from Syria ($56,830, a difference of 0.28%).
| Demographics | Rating | Rank | Median Male Earnings |
| Slovenes | 93.1 /100 | #123 | Exceptional $57,145 |
| Chileans | 91.9 /100 | #124 | Exceptional $56,973 |
| Immigrants | Morocco | 91.8 /100 | #125 | Exceptional $56,958 |
| Chinese | 91.1 /100 | #126 | Exceptional $56,872 |
| Brazilians | 90.9 /100 | #127 | Exceptional $56,837 |
| Immigrants | Syria | 90.8 /100 | #128 | Exceptional $56,830 |
| Pakistanis | 89.9 /100 | #129 | Excellent $56,719 |
| Koreans | 89.4 /100 | #130 | Excellent $56,672 |
| Portuguese | 89.4 /100 | #131 | Excellent $56,663 |
| Czechs | 88.2 /100 | #132 | Excellent $56,546 |
| Immigrants | Germany | 88.2 /100 | #133 | Excellent $56,542 |
| Moroccans | 87.7 /100 | #134 | Excellent $56,499 |
| Irish | 87.4 /100 | #135 | Excellent $56,464 |
| Immigrants | Saudi Arabia | 87.2 /100 | #136 | Excellent $56,452 |
| Slavs | 86.5 /100 | #137 | Excellent $56,390 |
Demographics Similar to Immigrants from Czechoslovakia by Median Male Earnings
In terms of median male earnings, the demographic groups most similar to Immigrants from Czechoslovakia are Immigrants from Austria ($62,164, a difference of 0.090%), Immigrants from Malaysia ($62,121, a difference of 0.15%), Bulgarian ($62,378, a difference of 0.26%), Immigrants from Europe ($62,057, a difference of 0.26%), and Cambodian ($62,516, a difference of 0.48%).
| Demographics | Rating | Rank | Median Male Earnings |
| Immigrants | South Africa | 100.0 /100 | #39 | Exceptional $62,899 |
| Australians | 100.0 /100 | #40 | Exceptional $62,857 |
| Immigrants | Turkey | 100.0 /100 | #41 | Exceptional $62,728 |
| Immigrants | Greece | 100.0 /100 | #42 | Exceptional $62,689 |
| Immigrants | Belarus | 100.0 /100 | #43 | Exceptional $62,658 |
| Cambodians | 100.0 /100 | #44 | Exceptional $62,516 |
| Bulgarians | 100.0 /100 | #45 | Exceptional $62,378 |
| Immigrants | Czechoslovakia | 99.9 /100 | #46 | Exceptional $62,217 |
| Immigrants | Austria | 99.9 /100 | #47 | Exceptional $62,164 |
| Immigrants | Malaysia | 99.9 /100 | #48 | Exceptional $62,121 |
| Immigrants | Europe | 99.9 /100 | #49 | Exceptional $62,057 |
| Bhutanese | 99.9 /100 | #50 | Exceptional $61,759 |
| Estonians | 99.9 /100 | #51 | Exceptional $61,710 |
| Immigrants | Norway | 99.9 /100 | #52 | Exceptional $61,628 |
| South Africans | 99.9 /100 | #53 | Exceptional $61,460 |