Korean vs Immigrants from Jordan Median Male Earnings
COMPARE
Korean
Immigrants from Jordan
Median Male Earnings
Median Male Earnings Comparison
Koreans
Immigrants from Jordan
$56,672
MEDIAN MALE EARNINGS
89.4/ 100
METRIC RATING
130th/ 347
METRIC RANK
$57,145
MEDIAN MALE EARNINGS
93.1/ 100
METRIC RATING
122nd/ 347
METRIC RANK
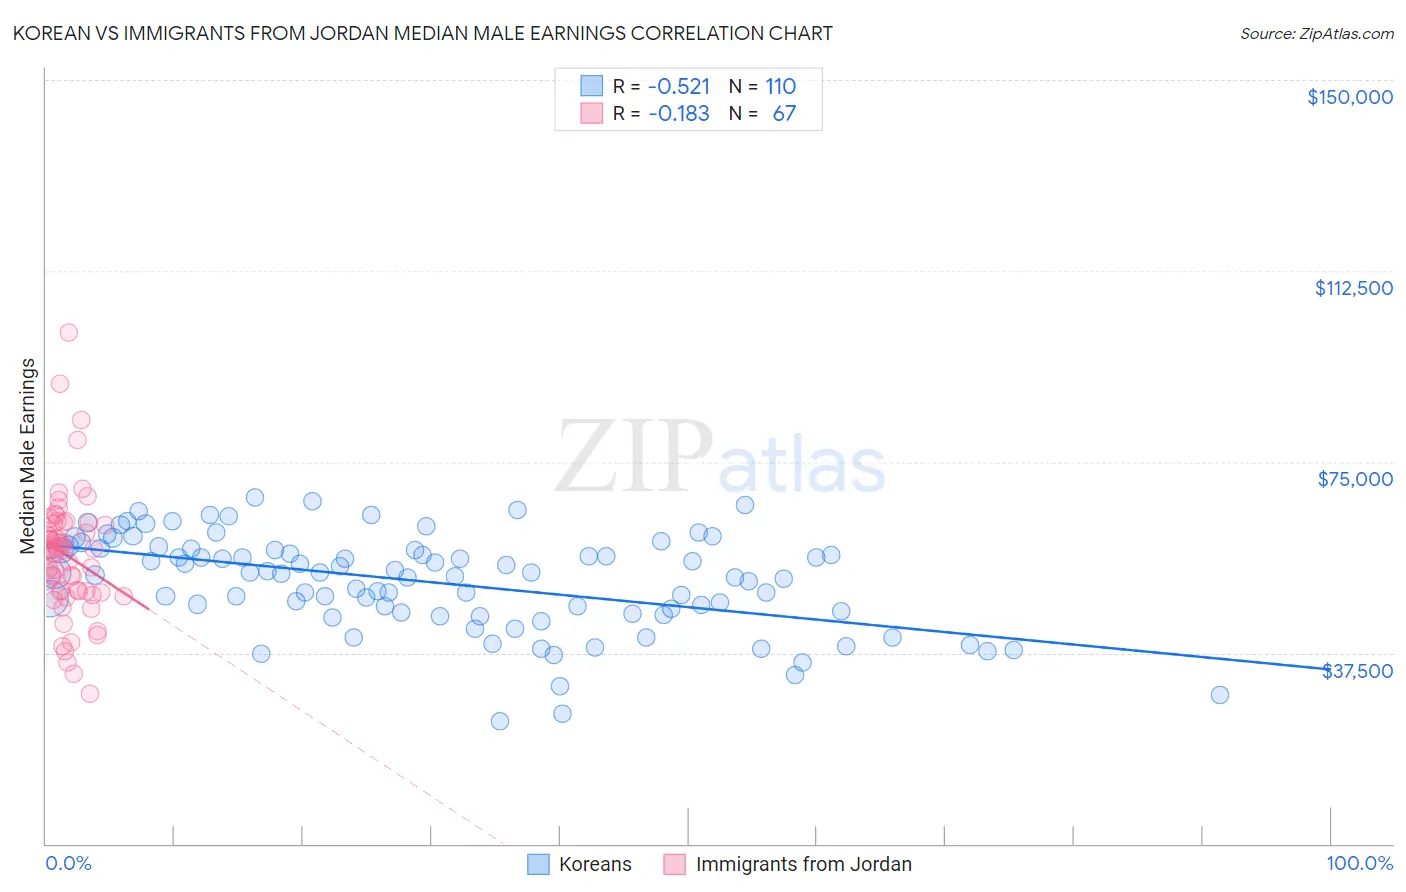
Korean vs Immigrants from Jordan Median Male Earnings Correlation Chart
The statistical analysis conducted on geographies consisting of 510,664,628 people shows a substantial negative correlation between the proportion of Koreans and median male earnings in the United States with a correlation coefficient (R) of -0.521 and weighted average of $56,672. Similarly, the statistical analysis conducted on geographies consisting of 181,244,251 people shows a poor negative correlation between the proportion of Immigrants from Jordan and median male earnings in the United States with a correlation coefficient (R) of -0.183 and weighted average of $57,145, a difference of 0.83%.
Median Male Earnings Correlation Summary
| Measurement | Korean | Immigrants from Jordan |
| Minimum | $24,028 | $29,414 |
| Maximum | $67,994 | $100,501 |
| Range | $43,966 | $71,087 |
| Mean | $51,299 | $56,566 |
| Median | $53,093 | $57,678 |
| Interquartile 25% (IQ1) | $45,357 | $49,640 |
| Interquartile 75% (IQ3) | $57,742 | $62,778 |
| Interquartile Range (IQR) | $12,385 | $13,138 |
| Standard Deviation (Sample) | $9,399 | $12,126 |
| Standard Deviation (Population) | $9,356 | $12,035 |
Demographics Similar to Koreans and Immigrants from Jordan by Median Male Earnings
In terms of median male earnings, the demographic groups most similar to Koreans are Portuguese ($56,663, a difference of 0.020%), Pakistani ($56,719, a difference of 0.080%), Czech ($56,546, a difference of 0.22%), Immigrants from Germany ($56,542, a difference of 0.23%), and Immigrants from Syria ($56,830, a difference of 0.28%). Similarly, the demographic groups most similar to Immigrants from Jordan are Slovene ($57,145, a difference of 0.0%), Immigrants from Albania ($57,179, a difference of 0.060%), Canadian ($57,286, a difference of 0.25%), Arab ($57,298, a difference of 0.27%), and Hungarian ($57,309, a difference of 0.29%).
| Demographics | Rating | Rank | Median Male Earnings |
| Lebanese | 94.6 /100 | #116 | Exceptional $57,409 |
| Immigrants | Zimbabwe | 94.3 /100 | #117 | Exceptional $57,352 |
| Hungarians | 94.0 /100 | #118 | Exceptional $57,309 |
| Arabs | 94.0 /100 | #119 | Exceptional $57,298 |
| Canadians | 93.9 /100 | #120 | Exceptional $57,286 |
| Immigrants | Albania | 93.3 /100 | #121 | Exceptional $57,179 |
| Immigrants | Jordan | 93.1 /100 | #122 | Exceptional $57,145 |
| Slovenes | 93.1 /100 | #123 | Exceptional $57,145 |
| Chileans | 91.9 /100 | #124 | Exceptional $56,973 |
| Immigrants | Morocco | 91.8 /100 | #125 | Exceptional $56,958 |
| Chinese | 91.1 /100 | #126 | Exceptional $56,872 |
| Brazilians | 90.9 /100 | #127 | Exceptional $56,837 |
| Immigrants | Syria | 90.8 /100 | #128 | Exceptional $56,830 |
| Pakistanis | 89.9 /100 | #129 | Excellent $56,719 |
| Koreans | 89.4 /100 | #130 | Excellent $56,672 |
| Portuguese | 89.4 /100 | #131 | Excellent $56,663 |
| Czechs | 88.2 /100 | #132 | Excellent $56,546 |
| Immigrants | Germany | 88.2 /100 | #133 | Excellent $56,542 |
| Moroccans | 87.7 /100 | #134 | Excellent $56,499 |
| Irish | 87.4 /100 | #135 | Excellent $56,464 |
| Immigrants | Saudi Arabia | 87.2 /100 | #136 | Excellent $56,452 |