Korean vs Alaska Native In Labor Force | Age 25-29
COMPARE
Korean
Alaska Native
In Labor Force | Age 25-29
In Labor Force | Age 25-29 Comparison
Koreans
Alaska Natives
84.2%
IN LABOR FORCE | AGE 25-29
5.9/ 100
METRIC RATING
225th/ 347
METRIC RANK
81.6%
IN LABOR FORCE | AGE 25-29
0.0/ 100
METRIC RATING
323rd/ 347
METRIC RANK
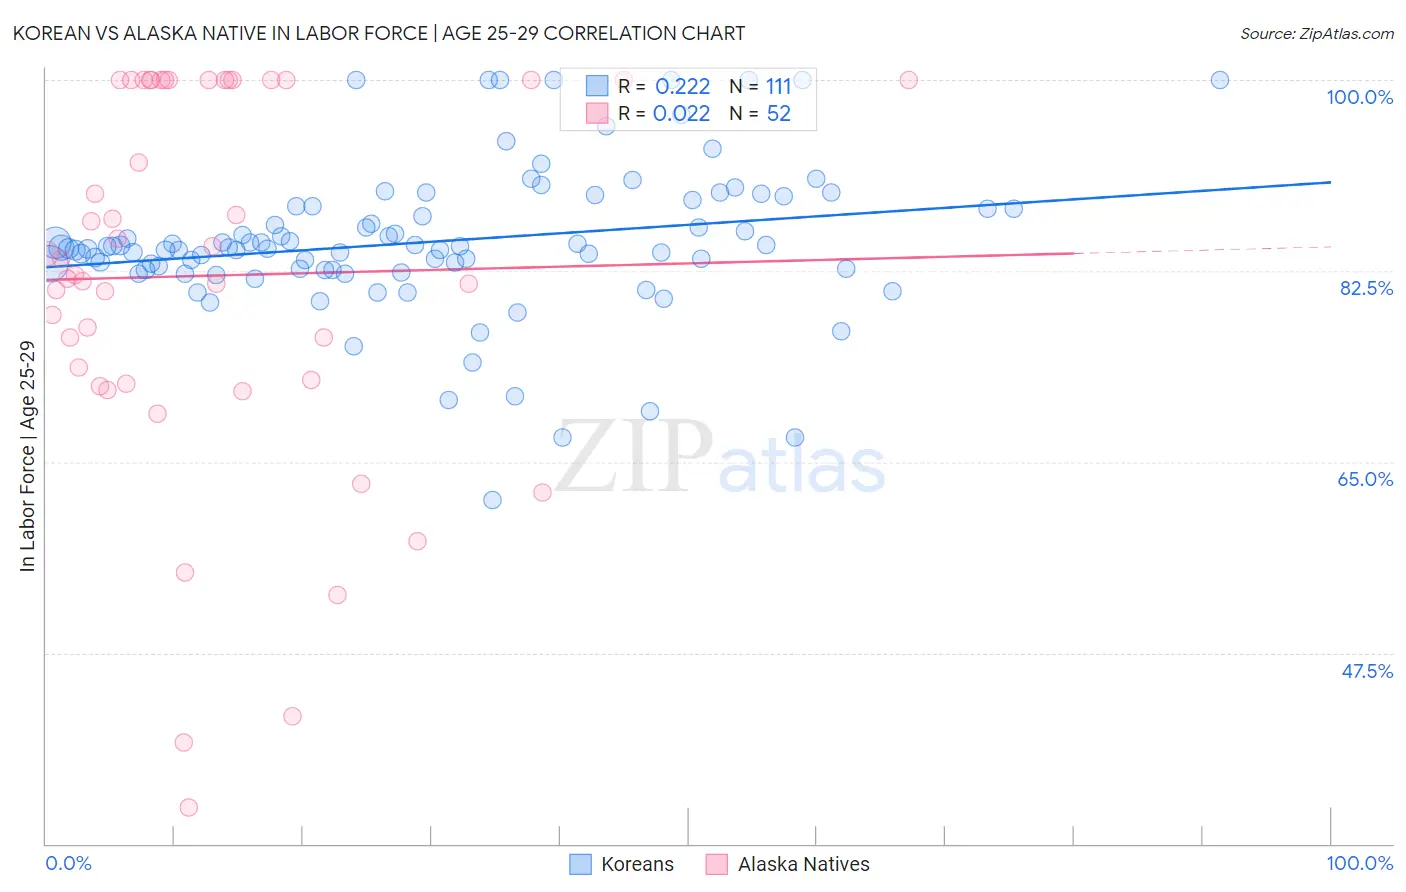
Korean vs Alaska Native In Labor Force | Age 25-29 Correlation Chart
The statistical analysis conducted on geographies consisting of 510,593,269 people shows a weak positive correlation between the proportion of Koreans and labor force participation rate among population between the ages 25 and 29 in the United States with a correlation coefficient (R) of 0.222 and weighted average of 84.2%. Similarly, the statistical analysis conducted on geographies consisting of 76,769,069 people shows no correlation between the proportion of Alaska Natives and labor force participation rate among population between the ages 25 and 29 in the United States with a correlation coefficient (R) of 0.022 and weighted average of 81.6%, a difference of 3.3%.
In Labor Force | Age 25-29 Correlation Summary
| Measurement | Korean | Alaska Native |
| Minimum | 61.5% | 33.3% |
| Maximum | 100.0% | 100.0% |
| Range | 38.5% | 66.7% |
| Mean | 85.2% | 82.1% |
| Median | 84.6% | 82.8% |
| Interquartile 25% (IQ1) | 82.6% | 72.3% |
| Interquartile 75% (IQ3) | 88.4% | 100.0% |
| Interquartile Range (IQR) | 5.8% | 27.7% |
| Standard Deviation (Sample) | 6.8% | 17.4% |
| Standard Deviation (Population) | 6.8% | 17.2% |
Similar Demographics by In Labor Force | Age 25-29
Demographics Similar to Koreans by In Labor Force | Age 25-29
In terms of in labor force | age 25-29, the demographic groups most similar to Koreans are Immigrants from Congo (84.2%, a difference of 0.0%), Immigrants from West Indies (84.2%, a difference of 0.010%), French American Indian (84.2%, a difference of 0.010%), Immigrants from Panama (84.2%, a difference of 0.010%), and Scotch-Irish (84.2%, a difference of 0.020%).
| Demographics | Rating | Rank | In Labor Force | Age 25-29 |
| Immigrants | Nigeria | 9.0 /100 | #218 | Tragic 84.3% |
| Immigrants | Saudi Arabia | 8.8 /100 | #219 | Tragic 84.3% |
| Nigerians | 7.2 /100 | #220 | Tragic 84.3% |
| Arabs | 6.8 /100 | #221 | Tragic 84.2% |
| Jordanians | 6.7 /100 | #222 | Tragic 84.2% |
| Scotch-Irish | 6.5 /100 | #223 | Tragic 84.2% |
| Immigrants | West Indies | 6.0 /100 | #224 | Tragic 84.2% |
| Koreans | 5.9 /100 | #225 | Tragic 84.2% |
| Immigrants | Congo | 5.8 /100 | #226 | Tragic 84.2% |
| French American Indians | 5.5 /100 | #227 | Tragic 84.2% |
| Immigrants | Panama | 5.5 /100 | #228 | Tragic 84.2% |
| Immigrants | Oceania | 5.0 /100 | #229 | Tragic 84.2% |
| Whites/Caucasians | 4.8 /100 | #230 | Tragic 84.2% |
| Immigrants | Philippines | 4.7 /100 | #231 | Tragic 84.2% |
| Panamanians | 4.5 /100 | #232 | Tragic 84.2% |
Demographics Similar to Alaska Natives by In Labor Force | Age 25-29
In terms of in labor force | age 25-29, the demographic groups most similar to Alaska Natives are Kiowa (81.6%, a difference of 0.050%), Shoshone (81.6%, a difference of 0.060%), Colville (81.6%, a difference of 0.11%), Seminole (81.7%, a difference of 0.16%), and Comanche (81.9%, a difference of 0.38%).
| Demographics | Rating | Rank | In Labor Force | Age 25-29 |
| Mexicans | 0.0 /100 | #316 | Tragic 81.9% |
| Chickasaw | 0.0 /100 | #317 | Tragic 81.9% |
| Comanche | 0.0 /100 | #318 | Tragic 81.9% |
| Seminole | 0.0 /100 | #319 | Tragic 81.7% |
| Colville | 0.0 /100 | #320 | Tragic 81.6% |
| Shoshone | 0.0 /100 | #321 | Tragic 81.6% |
| Kiowa | 0.0 /100 | #322 | Tragic 81.6% |
| Alaska Natives | 0.0 /100 | #323 | Tragic 81.6% |
| Houma | 0.0 /100 | #324 | Tragic 81.2% |
| Dutch West Indians | 0.0 /100 | #325 | Tragic 81.1% |
| Choctaw | 0.0 /100 | #326 | Tragic 81.0% |
| Ute | 0.0 /100 | #327 | Tragic 80.8% |
| Creek | 0.0 /100 | #328 | Tragic 80.7% |
| Yakama | 0.0 /100 | #329 | Tragic 80.6% |
| Puerto Ricans | 0.0 /100 | #330 | Tragic 80.4% |