Kiowa vs Luxembourger Median Family Income
COMPARE
Kiowa
Luxembourger
Median Family Income
Median Family Income Comparison
Kiowa
Luxembourgers
$80,885
MEDIAN FAMILY INCOME
0.0/ 100
METRIC RATING
333rd/ 347
METRIC RANK
$106,183
MEDIAN FAMILY INCOME
85.7/ 100
METRIC RATING
139th/ 347
METRIC RANK
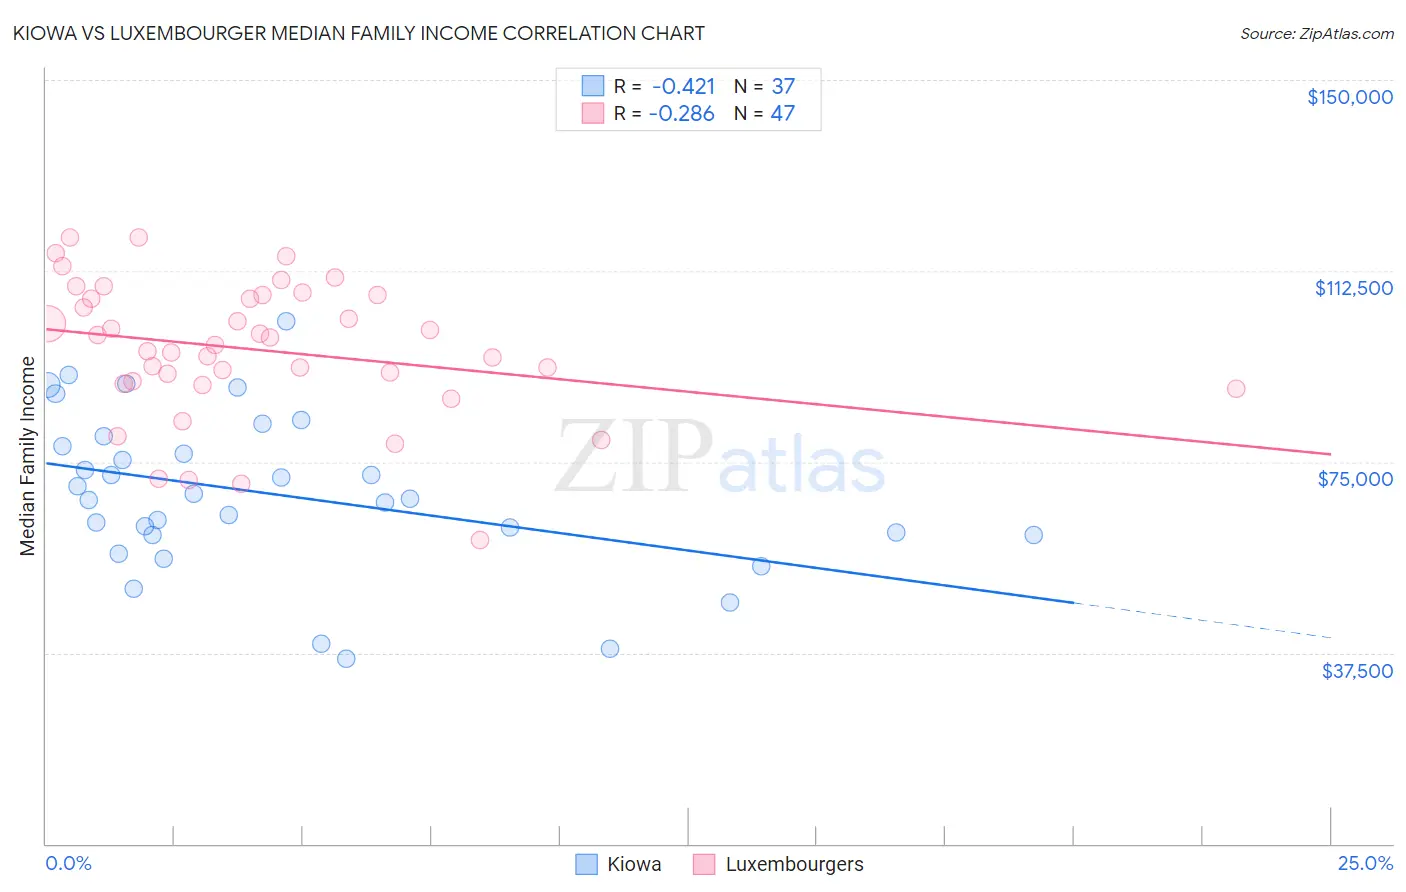
Kiowa vs Luxembourger Median Family Income Correlation Chart
The statistical analysis conducted on geographies consisting of 56,095,481 people shows a moderate negative correlation between the proportion of Kiowa and median family income in the United States with a correlation coefficient (R) of -0.421 and weighted average of $80,885. Similarly, the statistical analysis conducted on geographies consisting of 144,621,768 people shows a weak negative correlation between the proportion of Luxembourgers and median family income in the United States with a correlation coefficient (R) of -0.286 and weighted average of $106,183, a difference of 31.3%.
Median Family Income Correlation Summary
| Measurement | Kiowa | Luxembourger |
| Minimum | $36,250 | $59,760 |
| Maximum | $102,708 | $119,103 |
| Range | $66,458 | $59,343 |
| Mean | $68,555 | $97,013 |
| Median | $67,750 | $97,838 |
| Interquartile 25% (IQ1) | $60,573 | $90,352 |
| Interquartile 75% (IQ3) | $79,021 | $107,750 |
| Interquartile Range (IQR) | $18,448 | $17,398 |
| Standard Deviation (Sample) | $15,572 | $13,448 |
| Standard Deviation (Population) | $15,360 | $13,305 |
Similar Demographics by Median Family Income
Demographics Similar to Kiowa by Median Family Income
In terms of median family income, the demographic groups most similar to Kiowa are Native/Alaskan ($80,908, a difference of 0.030%), Immigrants from Dominican Republic ($81,233, a difference of 0.43%), Cheyenne ($81,385, a difference of 0.62%), Dutch West Indian ($81,852, a difference of 1.2%), and Black/African American ($81,912, a difference of 1.3%).
| Demographics | Rating | Rank | Median Family Income |
| Immigrants | Congo | 0.0 /100 | #326 | Tragic $82,216 |
| Arapaho | 0.0 /100 | #327 | Tragic $82,064 |
| Blacks/African Americans | 0.0 /100 | #328 | Tragic $81,912 |
| Dutch West Indians | 0.0 /100 | #329 | Tragic $81,852 |
| Cheyenne | 0.0 /100 | #330 | Tragic $81,385 |
| Immigrants | Dominican Republic | 0.0 /100 | #331 | Tragic $81,233 |
| Natives/Alaskans | 0.0 /100 | #332 | Tragic $80,908 |
| Kiowa | 0.0 /100 | #333 | Tragic $80,885 |
| Menominee | 0.0 /100 | #334 | Tragic $79,563 |
| Yup'ik | 0.0 /100 | #335 | Tragic $79,290 |
| Immigrants | Cuba | 0.0 /100 | #336 | Tragic $78,249 |
| Yuman | 0.0 /100 | #337 | Tragic $78,055 |
| Immigrants | Yemen | 0.0 /100 | #338 | Tragic $77,457 |
| Pima | 0.0 /100 | #339 | Tragic $77,431 |
| Hopi | 0.0 /100 | #340 | Tragic $77,188 |
Demographics Similar to Luxembourgers by Median Family Income
In terms of median family income, the demographic groups most similar to Luxembourgers are Immigrants from Uganda ($106,188, a difference of 0.0%), Immigrants from Vietnam ($106,186, a difference of 0.0%), Norwegian ($106,144, a difference of 0.040%), Immigrants from South Eastern Asia ($106,252, a difference of 0.060%), and Immigrants from Syria ($106,118, a difference of 0.060%).
| Demographics | Rating | Rank | Median Family Income |
| Immigrants | Fiji | 87.8 /100 | #132 | Excellent $106,544 |
| Ugandans | 87.8 /100 | #133 | Excellent $106,541 |
| Immigrants | Oceania | 87.3 /100 | #134 | Excellent $106,453 |
| Portuguese | 86.3 /100 | #135 | Excellent $106,286 |
| Immigrants | South Eastern Asia | 86.1 /100 | #136 | Excellent $106,252 |
| Immigrants | Uganda | 85.7 /100 | #137 | Excellent $106,188 |
| Immigrants | Vietnam | 85.7 /100 | #138 | Excellent $106,186 |
| Luxembourgers | 85.7 /100 | #139 | Excellent $106,183 |
| Norwegians | 85.5 /100 | #140 | Excellent $106,144 |
| Immigrants | Syria | 85.3 /100 | #141 | Excellent $106,118 |
| Slovenes | 84.7 /100 | #142 | Excellent $106,020 |
| Tongans | 84.3 /100 | #143 | Excellent $105,967 |
| Immigrants | Morocco | 84.3 /100 | #144 | Excellent $105,964 |
| Danes | 83.8 /100 | #145 | Excellent $105,900 |
| Czechs | 83.4 /100 | #146 | Excellent $105,839 |