Kiowa vs Immigrants from Guyana Median Family Income
COMPARE
Kiowa
Immigrants from Guyana
Median Family Income
Median Family Income Comparison
Kiowa
Immigrants from Guyana
$80,885
MEDIAN FAMILY INCOME
0.0/ 100
METRIC RATING
333rd/ 347
METRIC RANK
$92,513
MEDIAN FAMILY INCOME
0.6/ 100
METRIC RATING
253rd/ 347
METRIC RANK
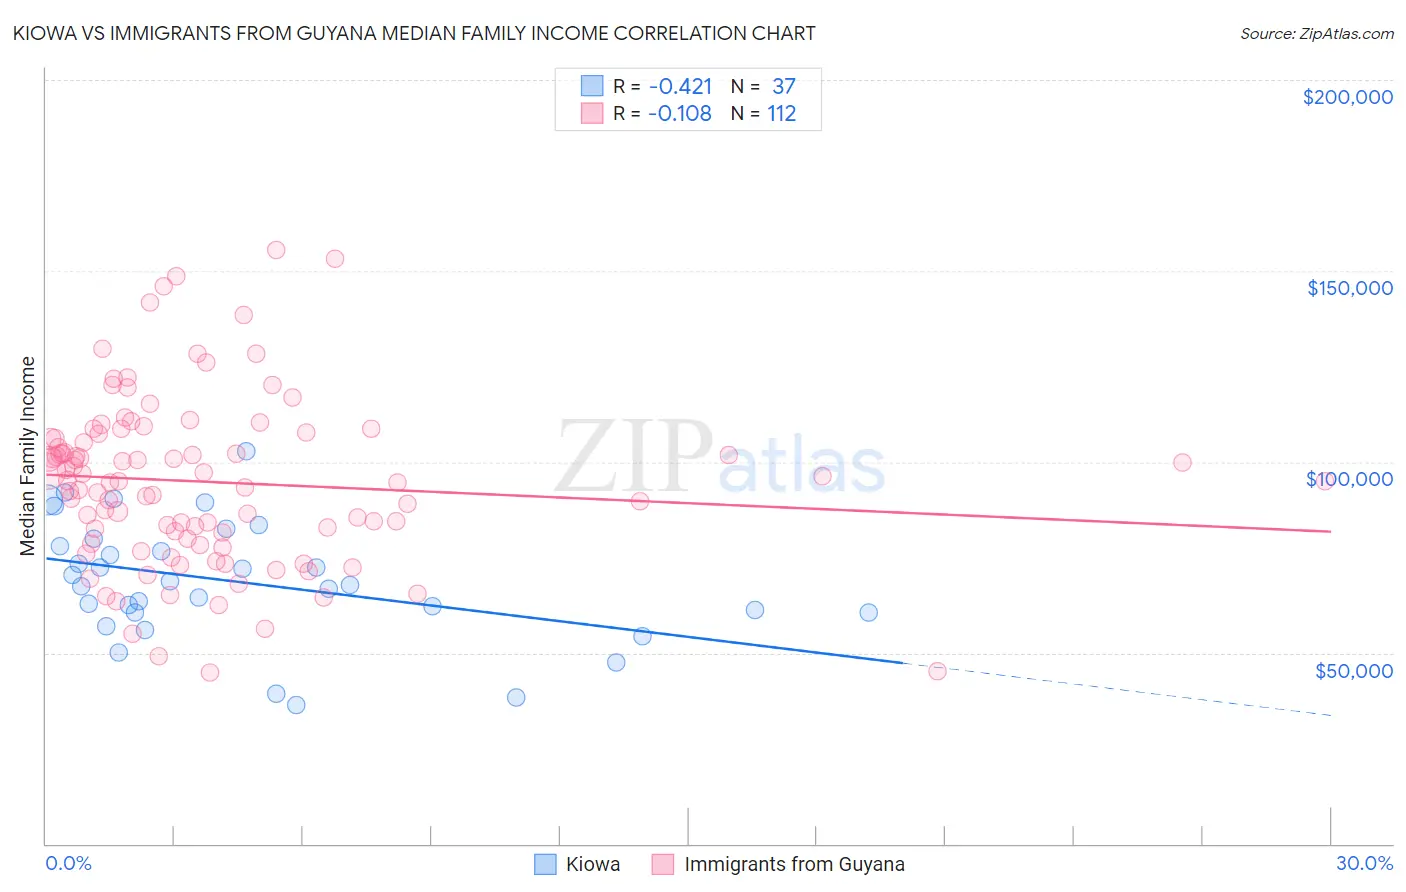
Kiowa vs Immigrants from Guyana Median Family Income Correlation Chart
The statistical analysis conducted on geographies consisting of 56,095,481 people shows a moderate negative correlation between the proportion of Kiowa and median family income in the United States with a correlation coefficient (R) of -0.421 and weighted average of $80,885. Similarly, the statistical analysis conducted on geographies consisting of 183,650,317 people shows a poor negative correlation between the proportion of Immigrants from Guyana and median family income in the United States with a correlation coefficient (R) of -0.108 and weighted average of $92,513, a difference of 14.4%.
Median Family Income Correlation Summary
| Measurement | Kiowa | Immigrants from Guyana |
| Minimum | $36,250 | $44,715 |
| Maximum | $102,708 | $155,346 |
| Range | $66,458 | $110,631 |
| Mean | $68,555 | $94,705 |
| Median | $67,750 | $94,807 |
| Interquartile 25% (IQ1) | $60,573 | $80,722 |
| Interquartile 75% (IQ3) | $79,021 | $106,748 |
| Interquartile Range (IQR) | $18,448 | $26,026 |
| Standard Deviation (Sample) | $15,572 | $22,061 |
| Standard Deviation (Population) | $15,360 | $21,962 |
Similar Demographics by Median Family Income
Demographics Similar to Kiowa by Median Family Income
In terms of median family income, the demographic groups most similar to Kiowa are Native/Alaskan ($80,908, a difference of 0.030%), Immigrants from Dominican Republic ($81,233, a difference of 0.43%), Cheyenne ($81,385, a difference of 0.62%), Dutch West Indian ($81,852, a difference of 1.2%), and Black/African American ($81,912, a difference of 1.3%).
| Demographics | Rating | Rank | Median Family Income |
| Immigrants | Congo | 0.0 /100 | #326 | Tragic $82,216 |
| Arapaho | 0.0 /100 | #327 | Tragic $82,064 |
| Blacks/African Americans | 0.0 /100 | #328 | Tragic $81,912 |
| Dutch West Indians | 0.0 /100 | #329 | Tragic $81,852 |
| Cheyenne | 0.0 /100 | #330 | Tragic $81,385 |
| Immigrants | Dominican Republic | 0.0 /100 | #331 | Tragic $81,233 |
| Natives/Alaskans | 0.0 /100 | #332 | Tragic $80,908 |
| Kiowa | 0.0 /100 | #333 | Tragic $80,885 |
| Menominee | 0.0 /100 | #334 | Tragic $79,563 |
| Yup'ik | 0.0 /100 | #335 | Tragic $79,290 |
| Immigrants | Cuba | 0.0 /100 | #336 | Tragic $78,249 |
| Yuman | 0.0 /100 | #337 | Tragic $78,055 |
| Immigrants | Yemen | 0.0 /100 | #338 | Tragic $77,457 |
| Pima | 0.0 /100 | #339 | Tragic $77,431 |
| Hopi | 0.0 /100 | #340 | Tragic $77,188 |
Demographics Similar to Immigrants from Guyana by Median Family Income
In terms of median family income, the demographic groups most similar to Immigrants from Guyana are Immigrants from El Salvador ($92,545, a difference of 0.030%), Immigrants from Somalia ($92,609, a difference of 0.10%), Immigrants from Barbados ($92,419, a difference of 0.10%), West Indian ($92,765, a difference of 0.27%), and Immigrants from Laos ($92,239, a difference of 0.30%).
| Demographics | Rating | Rank | Median Family Income |
| Guyanese | 0.9 /100 | #246 | Tragic $93,373 |
| Immigrants | Senegal | 0.7 /100 | #247 | Tragic $92,912 |
| French American Indians | 0.7 /100 | #248 | Tragic $92,872 |
| Immigrants | Ecuador | 0.7 /100 | #249 | Tragic $92,837 |
| West Indians | 0.6 /100 | #250 | Tragic $92,765 |
| Immigrants | Somalia | 0.6 /100 | #251 | Tragic $92,609 |
| Immigrants | El Salvador | 0.6 /100 | #252 | Tragic $92,545 |
| Immigrants | Guyana | 0.6 /100 | #253 | Tragic $92,513 |
| Immigrants | Barbados | 0.5 /100 | #254 | Tragic $92,419 |
| Immigrants | Laos | 0.5 /100 | #255 | Tragic $92,239 |
| Nicaraguans | 0.5 /100 | #256 | Tragic $92,231 |
| Americans | 0.4 /100 | #257 | Tragic $92,096 |
| Osage | 0.4 /100 | #258 | Tragic $91,926 |
| Cape Verdeans | 0.4 /100 | #259 | Tragic $91,848 |
| Pennsylvania Germans | 0.4 /100 | #260 | Tragic $91,763 |