Immigrants from Hungary vs Luxembourger Median Family Income
COMPARE
Immigrants from Hungary
Luxembourger
Median Family Income
Median Family Income Comparison
Immigrants from Hungary
Luxembourgers
$111,378
MEDIAN FAMILY INCOME
98.8/ 100
METRIC RATING
84th/ 347
METRIC RANK
$106,183
MEDIAN FAMILY INCOME
85.7/ 100
METRIC RATING
139th/ 347
METRIC RANK
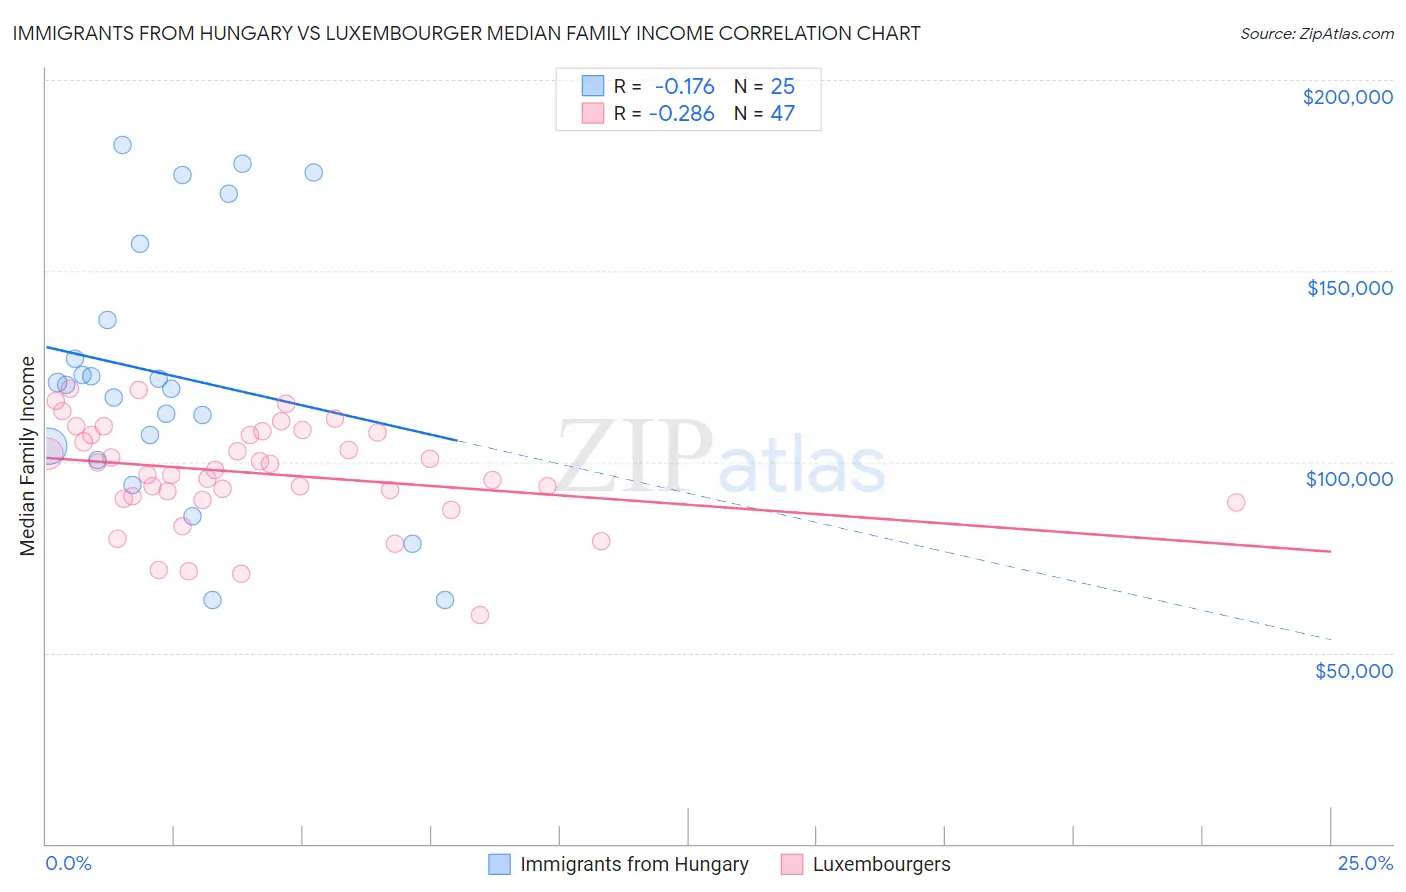
Immigrants from Hungary vs Luxembourger Median Family Income Correlation Chart
The statistical analysis conducted on geographies consisting of 195,642,900 people shows a poor negative correlation between the proportion of Immigrants from Hungary and median family income in the United States with a correlation coefficient (R) of -0.176 and weighted average of $111,378. Similarly, the statistical analysis conducted on geographies consisting of 144,621,768 people shows a weak negative correlation between the proportion of Luxembourgers and median family income in the United States with a correlation coefficient (R) of -0.286 and weighted average of $106,183, a difference of 4.9%.
Median Family Income Correlation Summary
| Measurement | Immigrants from Hungary | Luxembourger |
| Minimum | $63,750 | $59,760 |
| Maximum | $183,055 | $119,103 |
| Range | $119,305 | $59,343 |
| Mean | $122,792 | $97,013 |
| Median | $120,051 | $97,838 |
| Interquartile 25% (IQ1) | $102,275 | $90,352 |
| Interquartile 75% (IQ3) | $147,198 | $107,750 |
| Interquartile Range (IQR) | $44,923 | $17,398 |
| Standard Deviation (Sample) | $34,384 | $13,448 |
| Standard Deviation (Population) | $33,690 | $13,305 |
Similar Demographics by Median Family Income
Demographics Similar to Immigrants from Hungary by Median Family Income
In terms of median family income, the demographic groups most similar to Immigrants from Hungary are Croatian ($111,370, a difference of 0.010%), Ukrainian ($111,368, a difference of 0.010%), Austrian ($111,306, a difference of 0.060%), Romanian ($111,243, a difference of 0.12%), and Immigrants from Egypt ($111,689, a difference of 0.28%).
| Demographics | Rating | Rank | Median Family Income |
| Immigrants | Eastern Europe | 99.4 /100 | #77 | Exceptional $112,527 |
| Immigrants | Canada | 99.3 /100 | #78 | Exceptional $112,374 |
| Italians | 99.3 /100 | #79 | Exceptional $112,372 |
| Immigrants | Croatia | 99.3 /100 | #80 | Exceptional $112,323 |
| Immigrants | North America | 99.2 /100 | #81 | Exceptional $112,151 |
| Immigrants | England | 99.2 /100 | #82 | Exceptional $112,038 |
| Immigrants | Egypt | 99.0 /100 | #83 | Exceptional $111,689 |
| Immigrants | Hungary | 98.8 /100 | #84 | Exceptional $111,378 |
| Croatians | 98.8 /100 | #85 | Exceptional $111,370 |
| Ukrainians | 98.8 /100 | #86 | Exceptional $111,368 |
| Austrians | 98.8 /100 | #87 | Exceptional $111,306 |
| Romanians | 98.8 /100 | #88 | Exceptional $111,243 |
| Immigrants | Argentina | 98.5 /100 | #89 | Exceptional $110,873 |
| Northern Europeans | 98.3 /100 | #90 | Exceptional $110,635 |
| Immigrants | Southern Europe | 98.3 /100 | #91 | Exceptional $110,614 |
Demographics Similar to Luxembourgers by Median Family Income
In terms of median family income, the demographic groups most similar to Luxembourgers are Immigrants from Uganda ($106,188, a difference of 0.0%), Immigrants from Vietnam ($106,186, a difference of 0.0%), Norwegian ($106,144, a difference of 0.040%), Immigrants from South Eastern Asia ($106,252, a difference of 0.060%), and Immigrants from Syria ($106,118, a difference of 0.060%).
| Demographics | Rating | Rank | Median Family Income |
| Immigrants | Fiji | 87.8 /100 | #132 | Excellent $106,544 |
| Ugandans | 87.8 /100 | #133 | Excellent $106,541 |
| Immigrants | Oceania | 87.3 /100 | #134 | Excellent $106,453 |
| Portuguese | 86.3 /100 | #135 | Excellent $106,286 |
| Immigrants | South Eastern Asia | 86.1 /100 | #136 | Excellent $106,252 |
| Immigrants | Uganda | 85.7 /100 | #137 | Excellent $106,188 |
| Immigrants | Vietnam | 85.7 /100 | #138 | Excellent $106,186 |
| Luxembourgers | 85.7 /100 | #139 | Excellent $106,183 |
| Norwegians | 85.5 /100 | #140 | Excellent $106,144 |
| Immigrants | Syria | 85.3 /100 | #141 | Excellent $106,118 |
| Slovenes | 84.7 /100 | #142 | Excellent $106,020 |
| Tongans | 84.3 /100 | #143 | Excellent $105,967 |
| Immigrants | Morocco | 84.3 /100 | #144 | Excellent $105,964 |
| Danes | 83.8 /100 | #145 | Excellent $105,900 |
| Czechs | 83.4 /100 | #146 | Excellent $105,839 |