Immigrants from Philippines vs Luxembourger Median Family Income
COMPARE
Immigrants from Philippines
Luxembourger
Median Family Income
Median Family Income Comparison
Immigrants from Philippines
Luxembourgers
$108,288
MEDIAN FAMILY INCOME
94.6/ 100
METRIC RATING
117th/ 347
METRIC RANK
$106,183
MEDIAN FAMILY INCOME
85.7/ 100
METRIC RATING
139th/ 347
METRIC RANK
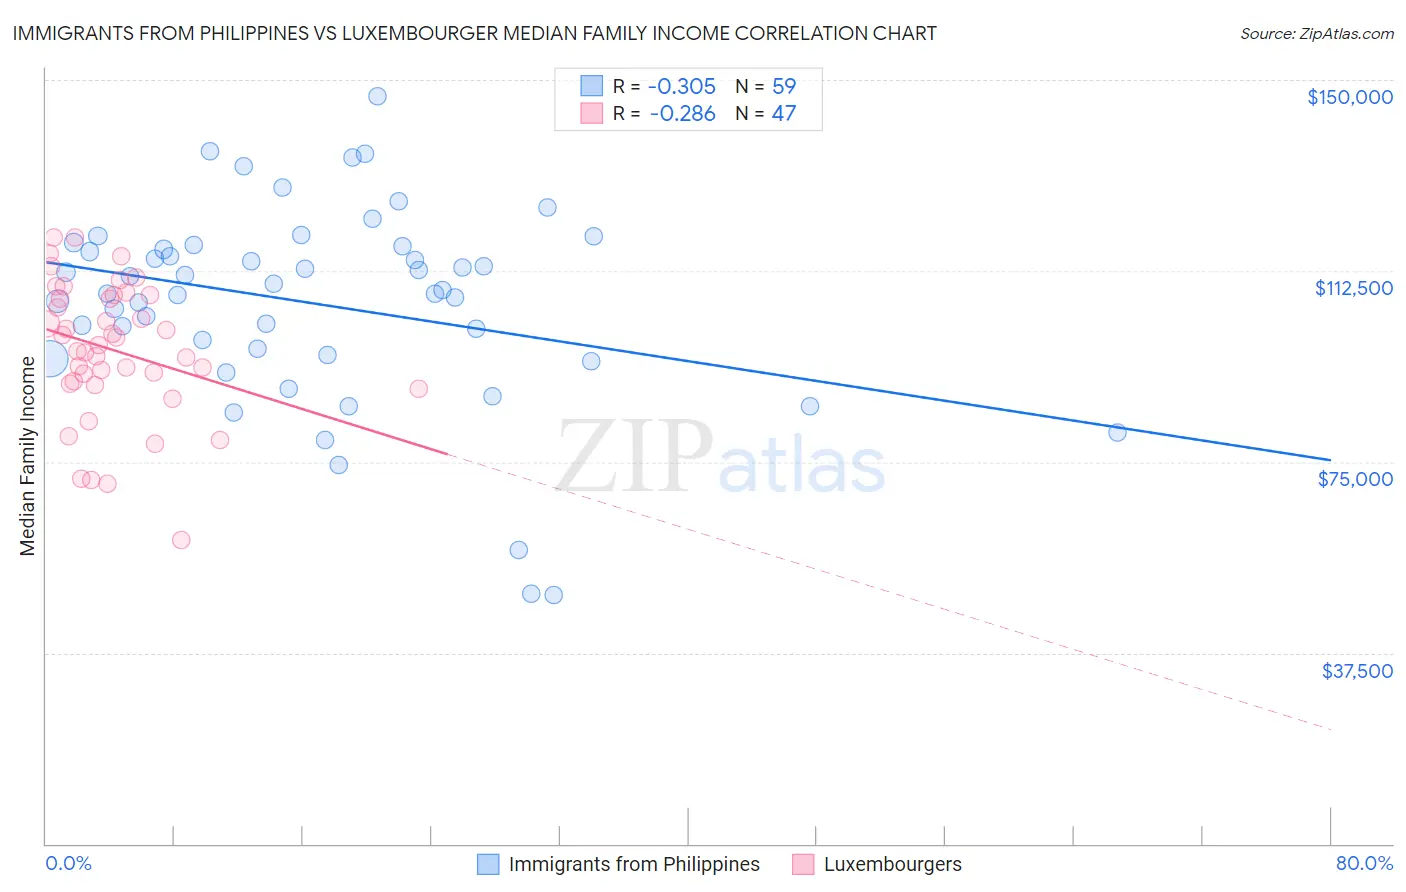
Immigrants from Philippines vs Luxembourger Median Family Income Correlation Chart
The statistical analysis conducted on geographies consisting of 470,858,648 people shows a mild negative correlation between the proportion of Immigrants from Philippines and median family income in the United States with a correlation coefficient (R) of -0.305 and weighted average of $108,288. Similarly, the statistical analysis conducted on geographies consisting of 144,621,768 people shows a weak negative correlation between the proportion of Luxembourgers and median family income in the United States with a correlation coefficient (R) of -0.286 and weighted average of $106,183, a difference of 2.0%.
Median Family Income Correlation Summary
| Measurement | Immigrants from Philippines | Luxembourger |
| Minimum | $48,750 | $59,760 |
| Maximum | $146,906 | $119,103 |
| Range | $98,156 | $59,343 |
| Mean | $106,076 | $97,013 |
| Median | $108,731 | $97,838 |
| Interquartile 25% (IQ1) | $96,071 | $90,352 |
| Interquartile 75% (IQ3) | $117,321 | $107,750 |
| Interquartile Range (IQR) | $21,250 | $17,398 |
| Standard Deviation (Sample) | $19,555 | $13,448 |
| Standard Deviation (Population) | $19,389 | $13,305 |
Similar Demographics by Median Family Income
Demographics Similar to Immigrants from Philippines by Median Family Income
In terms of median family income, the demographic groups most similar to Immigrants from Philippines are Ethiopian ($108,251, a difference of 0.030%), Sri Lankan ($108,234, a difference of 0.050%), Immigrants from Northern Africa ($108,161, a difference of 0.12%), Chilean ($108,429, a difference of 0.13%), and European ($108,099, a difference of 0.18%).
| Demographics | Rating | Rank | Median Family Income |
| British | 95.6 /100 | #110 | Exceptional $108,705 |
| Immigrants | Western Asia | 95.6 /100 | #111 | Exceptional $108,691 |
| Immigrants | Poland | 95.3 /100 | #112 | Exceptional $108,570 |
| Immigrants | Saudi Arabia | 95.2 /100 | #113 | Exceptional $108,544 |
| Poles | 95.2 /100 | #114 | Exceptional $108,507 |
| Swedes | 95.1 /100 | #115 | Exceptional $108,499 |
| Chileans | 95.0 /100 | #116 | Exceptional $108,429 |
| Immigrants | Philippines | 94.6 /100 | #117 | Exceptional $108,288 |
| Ethiopians | 94.5 /100 | #118 | Exceptional $108,251 |
| Sri Lankans | 94.5 /100 | #119 | Exceptional $108,234 |
| Immigrants | Northern Africa | 94.3 /100 | #120 | Exceptional $108,161 |
| Europeans | 94.1 /100 | #121 | Exceptional $108,099 |
| Immigrants | Jordan | 92.9 /100 | #122 | Exceptional $107,715 |
| Carpatho Rusyns | 92.2 /100 | #123 | Exceptional $107,502 |
| Pakistanis | 91.7 /100 | #124 | Exceptional $107,390 |
Demographics Similar to Luxembourgers by Median Family Income
In terms of median family income, the demographic groups most similar to Luxembourgers are Immigrants from Uganda ($106,188, a difference of 0.0%), Immigrants from Vietnam ($106,186, a difference of 0.0%), Norwegian ($106,144, a difference of 0.040%), Immigrants from South Eastern Asia ($106,252, a difference of 0.060%), and Immigrants from Syria ($106,118, a difference of 0.060%).
| Demographics | Rating | Rank | Median Family Income |
| Immigrants | Fiji | 87.8 /100 | #132 | Excellent $106,544 |
| Ugandans | 87.8 /100 | #133 | Excellent $106,541 |
| Immigrants | Oceania | 87.3 /100 | #134 | Excellent $106,453 |
| Portuguese | 86.3 /100 | #135 | Excellent $106,286 |
| Immigrants | South Eastern Asia | 86.1 /100 | #136 | Excellent $106,252 |
| Immigrants | Uganda | 85.7 /100 | #137 | Excellent $106,188 |
| Immigrants | Vietnam | 85.7 /100 | #138 | Excellent $106,186 |
| Luxembourgers | 85.7 /100 | #139 | Excellent $106,183 |
| Norwegians | 85.5 /100 | #140 | Excellent $106,144 |
| Immigrants | Syria | 85.3 /100 | #141 | Excellent $106,118 |
| Slovenes | 84.7 /100 | #142 | Excellent $106,020 |
| Tongans | 84.3 /100 | #143 | Excellent $105,967 |
| Immigrants | Morocco | 84.3 /100 | #144 | Excellent $105,964 |
| Danes | 83.8 /100 | #145 | Excellent $105,900 |
| Czechs | 83.4 /100 | #146 | Excellent $105,839 |