Jordanian vs Immigrants from Middle Africa Wage/Income Gap
COMPARE
Jordanian
Immigrants from Middle Africa
Wage/Income Gap
Wage/Income Gap Comparison
Jordanians
Immigrants from Middle Africa
26.8%
WAGE/INCOME GAP
8.0/ 100
METRIC RATING
223rd/ 347
METRIC RANK
22.4%
WAGE/INCOME GAP
100.0/ 100
METRIC RATING
60th/ 347
METRIC RANK
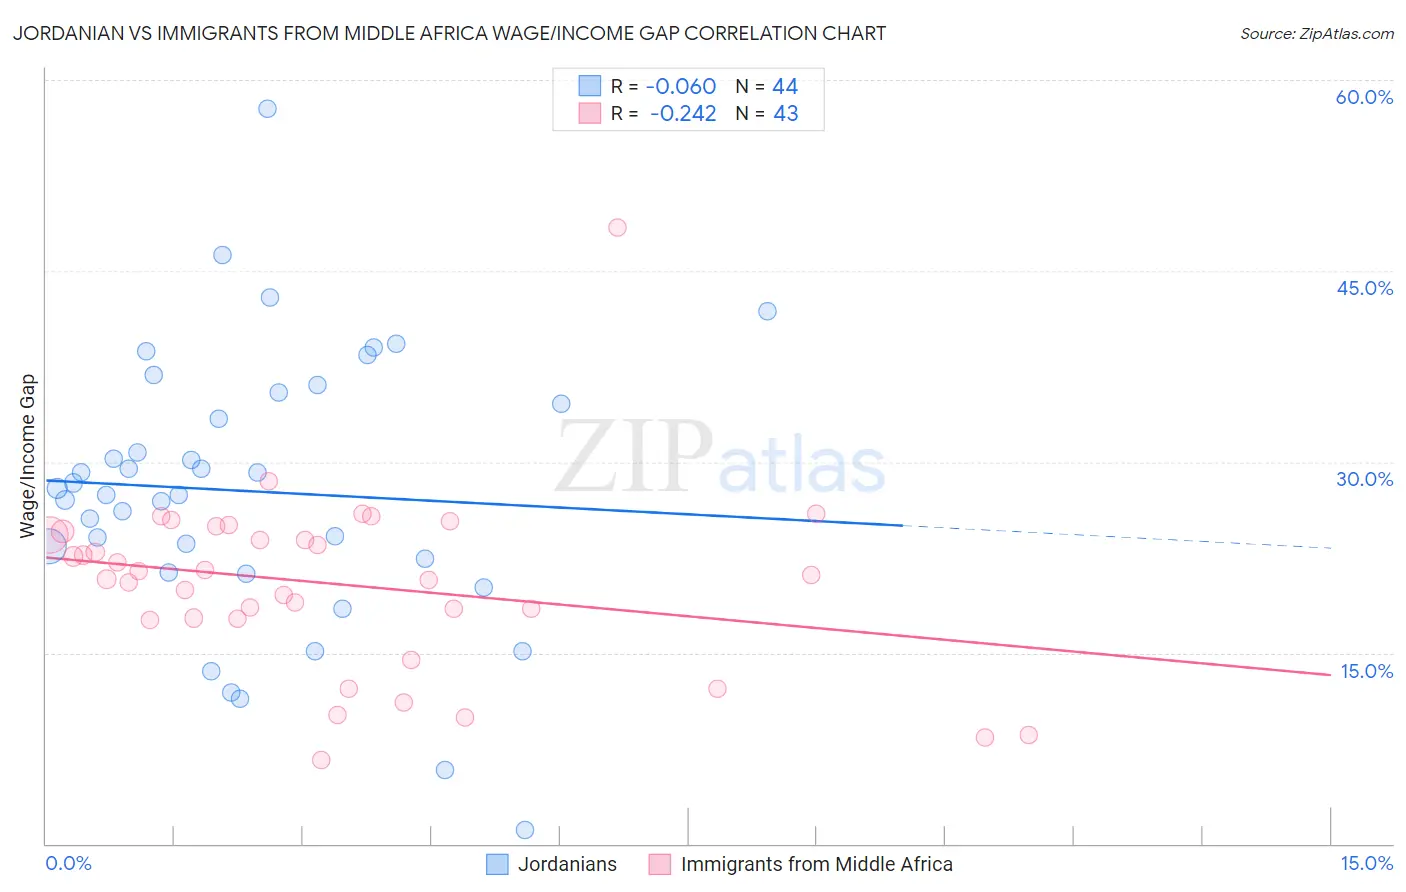
Jordanian vs Immigrants from Middle Africa Wage/Income Gap Correlation Chart
The statistical analysis conducted on geographies consisting of 166,410,383 people shows a slight negative correlation between the proportion of Jordanians and wage/income gap percentage in the United States with a correlation coefficient (R) of -0.060 and weighted average of 26.8%. Similarly, the statistical analysis conducted on geographies consisting of 202,693,436 people shows a weak negative correlation between the proportion of Immigrants from Middle Africa and wage/income gap percentage in the United States with a correlation coefficient (R) of -0.242 and weighted average of 22.4%, a difference of 19.8%.
Wage/Income Gap Correlation Summary
| Measurement | Jordanian | Immigrants from Middle Africa |
| Minimum | 1.1% | 6.5% |
| Maximum | 57.8% | 48.4% |
| Range | 56.7% | 41.9% |
| Mean | 27.7% | 20.4% |
| Median | 27.7% | 21.1% |
| Interquartile 25% (IQ1) | 21.8% | 17.7% |
| Interquartile 75% (IQ3) | 35.0% | 24.5% |
| Interquartile Range (IQR) | 13.2% | 6.9% |
| Standard Deviation (Sample) | 10.8% | 7.1% |
| Standard Deviation (Population) | 10.7% | 7.1% |
Similar Demographics by Wage/Income Gap
Demographics Similar to Jordanians by Wage/Income Gap
In terms of wage/income gap, the demographic groups most similar to Jordanians are Bolivian (26.8%, a difference of 0.070%), Immigrants from Spain (26.8%, a difference of 0.11%), Immigrants from Argentina (26.8%, a difference of 0.17%), Immigrants from Latvia (26.7%, a difference of 0.18%), and Immigrants from Poland (26.7%, a difference of 0.19%).
| Demographics | Rating | Rank | Wage/Income Gap |
| Immigrants | Portugal | 9.5 /100 | #216 | Tragic 26.7% |
| Brazilians | 9.2 /100 | #217 | Tragic 26.7% |
| Immigrants | Saudi Arabia | 9.1 /100 | #218 | Tragic 26.7% |
| Immigrants | Poland | 8.9 /100 | #219 | Tragic 26.7% |
| Immigrants | Latvia | 8.9 /100 | #220 | Tragic 26.7% |
| Immigrants | Spain | 8.5 /100 | #221 | Tragic 26.8% |
| Bolivians | 8.3 /100 | #222 | Tragic 26.8% |
| Jordanians | 8.0 /100 | #223 | Tragic 26.8% |
| Immigrants | Argentina | 7.2 /100 | #224 | Tragic 26.8% |
| Immigrants | Ireland | 6.5 /100 | #225 | Tragic 26.9% |
| Asians | 5.9 /100 | #226 | Tragic 26.9% |
| Spaniards | 5.6 /100 | #227 | Tragic 27.0% |
| Immigrants | Turkey | 5.6 /100 | #228 | Tragic 27.0% |
| Immigrants | Asia | 5.5 /100 | #229 | Tragic 27.0% |
| Ottawa | 5.3 /100 | #230 | Tragic 27.0% |
Demographics Similar to Immigrants from Middle Africa by Wage/Income Gap
In terms of wage/income gap, the demographic groups most similar to Immigrants from Middle Africa are Navajo (22.4%, a difference of 0.020%), Immigrants from Cuba (22.4%, a difference of 0.060%), Ghanaian (22.3%, a difference of 0.14%), Immigrants from Fiji (22.4%, a difference of 0.17%), and Immigrants from Ghana (22.3%, a difference of 0.24%).
| Demographics | Rating | Rank | Wage/Income Gap |
| Bangladeshis | 100.0 /100 | #53 | Exceptional 22.2% |
| Nepalese | 100.0 /100 | #54 | Exceptional 22.2% |
| Immigrants | Zaire | 100.0 /100 | #55 | Exceptional 22.3% |
| Immigrants | Ghana | 100.0 /100 | #56 | Exceptional 22.3% |
| Ghanaians | 100.0 /100 | #57 | Exceptional 22.3% |
| Immigrants | Cuba | 100.0 /100 | #58 | Exceptional 22.4% |
| Navajo | 100.0 /100 | #59 | Exceptional 22.4% |
| Immigrants | Middle Africa | 100.0 /100 | #60 | Exceptional 22.4% |
| Immigrants | Fiji | 100.0 /100 | #61 | Exceptional 22.4% |
| Immigrants | Guatemala | 100.0 /100 | #62 | Exceptional 22.5% |
| Immigrants | Ecuador | 100.0 /100 | #63 | Exceptional 22.5% |
| Spanish American Indians | 100.0 /100 | #64 | Exceptional 22.5% |
| Guatemalans | 99.9 /100 | #65 | Exceptional 22.6% |
| Central American Indians | 99.9 /100 | #66 | Exceptional 22.7% |
| Menominee | 99.9 /100 | #67 | Exceptional 22.7% |