Iroquois vs Immigrants from North America Wage/Income Gap
COMPARE
Iroquois
Immigrants from North America
Wage/Income Gap
Wage/Income Gap Comparison
Iroquois
Immigrants from North America
25.1%
WAGE/INCOME GAP
83.9/ 100
METRIC RATING
148th/ 347
METRIC RANK
28.4%
WAGE/INCOME GAP
0.2/ 100
METRIC RATING
297th/ 347
METRIC RANK
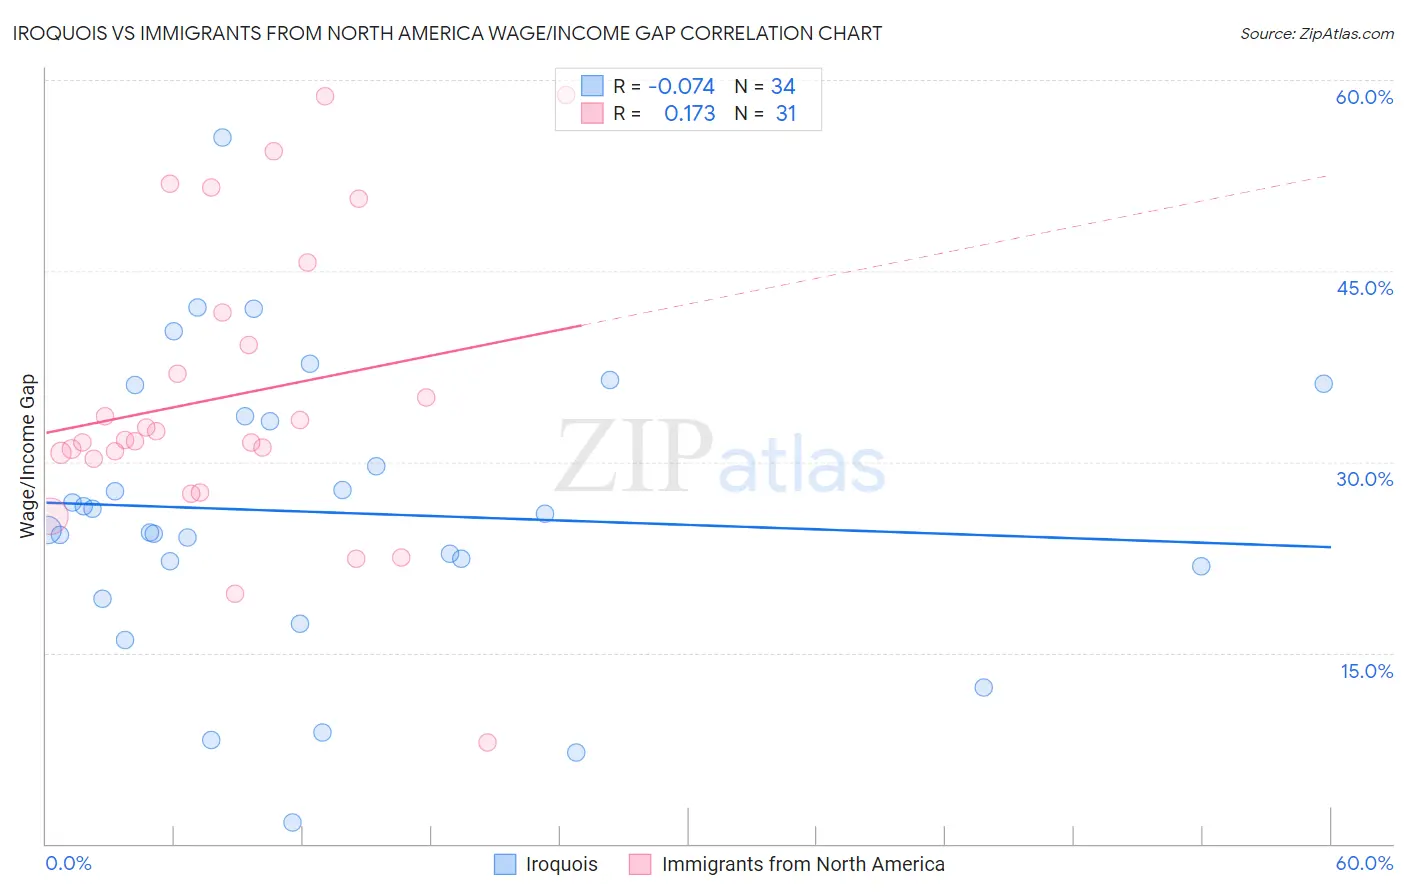
Iroquois vs Immigrants from North America Wage/Income Gap Correlation Chart
The statistical analysis conducted on geographies consisting of 207,171,754 people shows a slight negative correlation between the proportion of Iroquois and wage/income gap percentage in the United States with a correlation coefficient (R) of -0.074 and weighted average of 25.1%. Similarly, the statistical analysis conducted on geographies consisting of 461,849,295 people shows a poor positive correlation between the proportion of Immigrants from North America and wage/income gap percentage in the United States with a correlation coefficient (R) of 0.173 and weighted average of 28.4%, a difference of 13.3%.
Wage/Income Gap Correlation Summary
| Measurement | Iroquois | Immigrants from North America |
| Minimum | 1.6% | 8.0% |
| Maximum | 55.5% | 58.9% |
| Range | 53.9% | 50.9% |
| Mean | 26.0% | 35.2% |
| Median | 25.3% | 31.8% |
| Interquartile 25% (IQ1) | 21.8% | 30.2% |
| Interquartile 75% (IQ3) | 33.6% | 41.7% |
| Interquartile Range (IQR) | 11.8% | 11.5% |
| Standard Deviation (Sample) | 11.3% | 11.7% |
| Standard Deviation (Population) | 11.1% | 11.5% |
Similar Demographics by Wage/Income Gap
Demographics Similar to Iroquois by Wage/Income Gap
In terms of wage/income gap, the demographic groups most similar to Iroquois are Malaysian (25.0%, a difference of 0.14%), Immigrants from Peru (25.1%, a difference of 0.15%), Comanche (25.0%, a difference of 0.16%), South American (25.0%, a difference of 0.16%), and Immigrants (25.1%, a difference of 0.19%).
| Demographics | Rating | Rank | Wage/Income Gap |
| Hawaiians | 89.3 /100 | #141 | Excellent 24.9% |
| Afghans | 88.1 /100 | #142 | Excellent 24.9% |
| Immigrants | Uganda | 88.0 /100 | #143 | Excellent 24.9% |
| Chippewa | 86.9 /100 | #144 | Excellent 25.0% |
| Comanche | 85.2 /100 | #145 | Excellent 25.0% |
| South Americans | 85.2 /100 | #146 | Excellent 25.0% |
| Malaysians | 84.9 /100 | #147 | Excellent 25.0% |
| Iroquois | 83.9 /100 | #148 | Excellent 25.1% |
| Immigrants | Peru | 82.6 /100 | #149 | Excellent 25.1% |
| Immigrants | Immigrants | 82.3 /100 | #150 | Excellent 25.1% |
| Taiwanese | 81.6 /100 | #151 | Excellent 25.1% |
| Uruguayans | 81.3 /100 | #152 | Excellent 25.2% |
| Blackfeet | 78.1 /100 | #153 | Good 25.2% |
| Immigrants | Northern Africa | 78.1 /100 | #154 | Good 25.2% |
| Immigrants | Vietnam | 77.7 /100 | #155 | Good 25.2% |
Demographics Similar to Immigrants from North America by Wage/Income Gap
In terms of wage/income gap, the demographic groups most similar to Immigrants from North America are Austrian (28.4%, a difference of 0.0%), Immigrants from North Macedonia (28.4%, a difference of 0.050%), Immigrants from Northern Europe (28.5%, a difference of 0.17%), Immigrants from Canada (28.5%, a difference of 0.21%), and Scotch-Irish (28.5%, a difference of 0.24%).
| Demographics | Rating | Rank | Wage/Income Gap |
| Australians | 0.3 /100 | #290 | Tragic 28.2% |
| Czechoslovakians | 0.3 /100 | #291 | Tragic 28.2% |
| Immigrants | Australia | 0.3 /100 | #292 | Tragic 28.2% |
| Immigrants | Israel | 0.3 /100 | #293 | Tragic 28.2% |
| Greeks | 0.3 /100 | #294 | Tragic 28.2% |
| Slovenes | 0.3 /100 | #295 | Tragic 28.3% |
| Northern Europeans | 0.3 /100 | #296 | Tragic 28.3% |
| Immigrants | North America | 0.2 /100 | #297 | Tragic 28.4% |
| Austrians | 0.2 /100 | #298 | Tragic 28.4% |
| Immigrants | North Macedonia | 0.2 /100 | #299 | Tragic 28.4% |
| Immigrants | Northern Europe | 0.2 /100 | #300 | Tragic 28.5% |
| Immigrants | Canada | 0.2 /100 | #301 | Tragic 28.5% |
| Scotch-Irish | 0.2 /100 | #302 | Tragic 28.5% |
| Irish | 0.2 /100 | #303 | Tragic 28.5% |
| Immigrants | Netherlands | 0.2 /100 | #304 | Tragic 28.5% |