Inupiat vs Immigrants from Austria Median Family Income
COMPARE
Inupiat
Immigrants from Austria
Median Family Income
Median Family Income Comparison
Inupiat
Immigrants from Austria
$91,730
MEDIAN FAMILY INCOME
0.4/ 100
METRIC RATING
261st/ 347
METRIC RANK
$116,830
MEDIAN FAMILY INCOME
99.9/ 100
METRIC RATING
47th/ 347
METRIC RANK
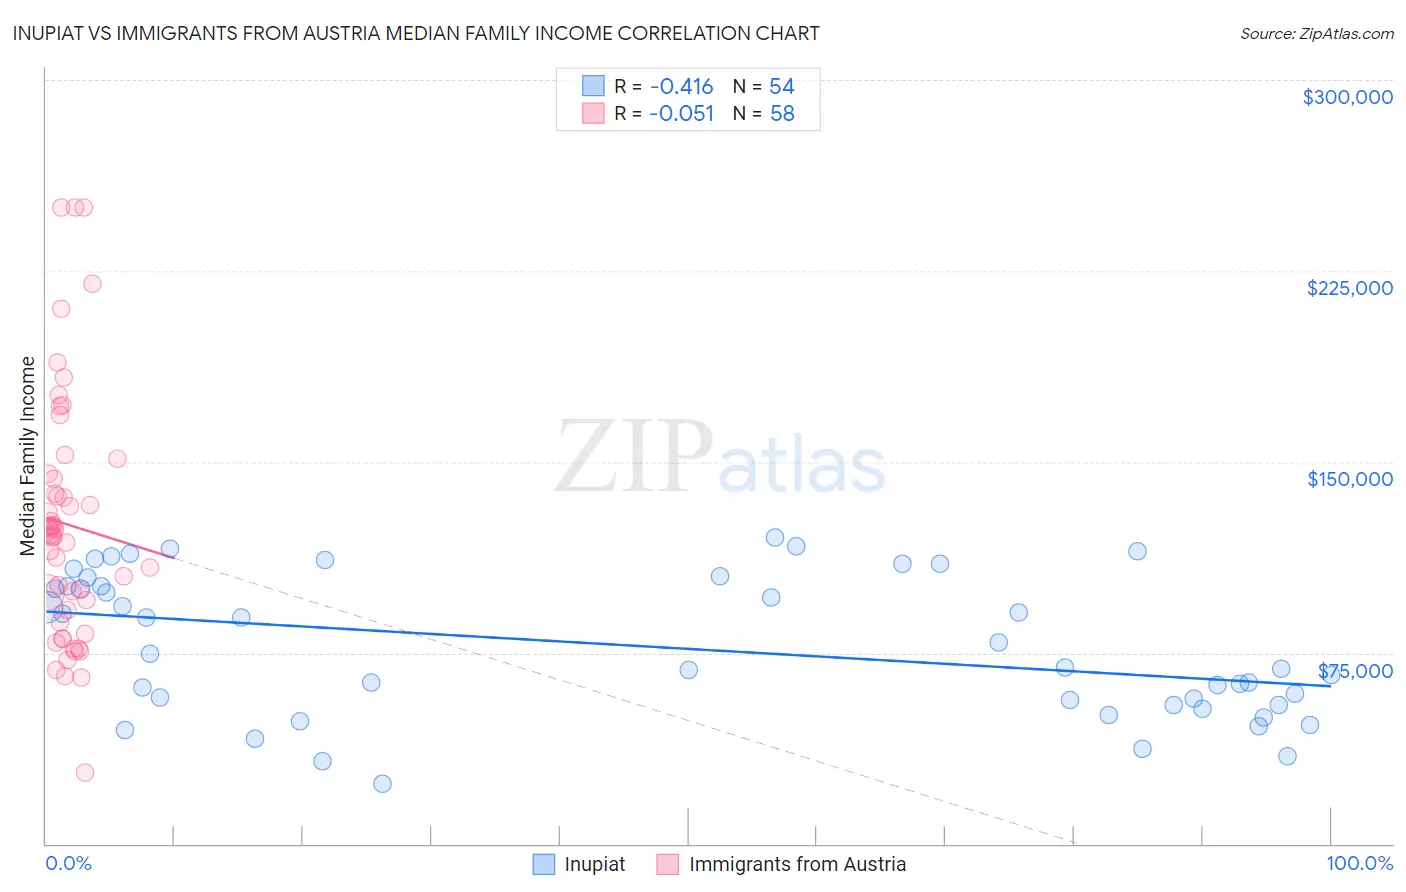
Inupiat vs Immigrants from Austria Median Family Income Correlation Chart
The statistical analysis conducted on geographies consisting of 96,309,592 people shows a moderate negative correlation between the proportion of Inupiat and median family income in the United States with a correlation coefficient (R) of -0.416 and weighted average of $91,730. Similarly, the statistical analysis conducted on geographies consisting of 167,957,927 people shows a slight negative correlation between the proportion of Immigrants from Austria and median family income in the United States with a correlation coefficient (R) of -0.051 and weighted average of $116,830, a difference of 27.4%.
Median Family Income Correlation Summary
| Measurement | Inupiat | Immigrants from Austria |
| Minimum | $23,690 | $28,077 |
| Maximum | $120,501 | $250,001 |
| Range | $96,811 | $221,924 |
| Mean | $77,500 | $125,494 |
| Median | $72,103 | $122,176 |
| Interquartile 25% (IQ1) | $54,583 | $91,605 |
| Interquartile 75% (IQ3) | $101,242 | $143,362 |
| Interquartile Range (IQR) | $46,659 | $51,756 |
| Standard Deviation (Sample) | $27,340 | $47,633 |
| Standard Deviation (Population) | $27,086 | $47,221 |
Similar Demographics by Median Family Income
Demographics Similar to Inupiat by Median Family Income
In terms of median family income, the demographic groups most similar to Inupiat are Liberian ($91,722, a difference of 0.010%), Pennsylvania German ($91,763, a difference of 0.040%), Cape Verdean ($91,848, a difference of 0.13%), Immigrants from West Indies ($91,588, a difference of 0.16%), and Osage ($91,926, a difference of 0.21%).
| Demographics | Rating | Rank | Median Family Income |
| Immigrants | Barbados | 0.5 /100 | #254 | Tragic $92,419 |
| Immigrants | Laos | 0.5 /100 | #255 | Tragic $92,239 |
| Nicaraguans | 0.5 /100 | #256 | Tragic $92,231 |
| Americans | 0.4 /100 | #257 | Tragic $92,096 |
| Osage | 0.4 /100 | #258 | Tragic $91,926 |
| Cape Verdeans | 0.4 /100 | #259 | Tragic $91,848 |
| Pennsylvania Germans | 0.4 /100 | #260 | Tragic $91,763 |
| Inupiat | 0.4 /100 | #261 | Tragic $91,730 |
| Liberians | 0.4 /100 | #262 | Tragic $91,722 |
| Immigrants | West Indies | 0.3 /100 | #263 | Tragic $91,588 |
| Senegalese | 0.3 /100 | #264 | Tragic $91,475 |
| Hmong | 0.3 /100 | #265 | Tragic $91,296 |
| Central Americans | 0.3 /100 | #266 | Tragic $91,087 |
| Mexican American Indians | 0.2 /100 | #267 | Tragic $90,918 |
| Cree | 0.2 /100 | #268 | Tragic $90,882 |
Demographics Similar to Immigrants from Austria by Median Family Income
In terms of median family income, the demographic groups most similar to Immigrants from Austria are Immigrants from Russia ($116,942, a difference of 0.10%), Immigrants from Greece ($117,344, a difference of 0.44%), Immigrants from South Africa ($116,286, a difference of 0.47%), Chinese ($116,188, a difference of 0.55%), and Immigrants from Czechoslovakia ($116,165, a difference of 0.57%).
| Demographics | Rating | Rank | Median Family Income |
| Immigrants | Lithuania | 100.0 /100 | #40 | Exceptional $118,053 |
| Estonians | 100.0 /100 | #41 | Exceptional $118,013 |
| Immigrants | Bolivia | 100.0 /100 | #42 | Exceptional $117,912 |
| Bulgarians | 100.0 /100 | #43 | Exceptional $117,818 |
| Cambodians | 100.0 /100 | #44 | Exceptional $117,780 |
| Immigrants | Greece | 99.9 /100 | #45 | Exceptional $117,344 |
| Immigrants | Russia | 99.9 /100 | #46 | Exceptional $116,942 |
| Immigrants | Austria | 99.9 /100 | #47 | Exceptional $116,830 |
| Immigrants | South Africa | 99.9 /100 | #48 | Exceptional $116,286 |
| Chinese | 99.9 /100 | #49 | Exceptional $116,188 |
| Immigrants | Czechoslovakia | 99.9 /100 | #50 | Exceptional $116,165 |
| Immigrants | Malaysia | 99.9 /100 | #51 | Exceptional $115,880 |
| Maltese | 99.9 /100 | #52 | Exceptional $115,862 |
| Immigrants | Norway | 99.9 /100 | #53 | Exceptional $115,847 |
| Immigrants | Europe | 99.9 /100 | #54 | Exceptional $115,523 |