Inupiat vs Immigrants from Albania Median Family Income
COMPARE
Inupiat
Immigrants from Albania
Median Family Income
Median Family Income Comparison
Inupiat
Immigrants from Albania
$91,730
MEDIAN FAMILY INCOME
0.4/ 100
METRIC RATING
261st/ 347
METRIC RANK
$105,285
MEDIAN FAMILY INCOME
79.1/ 100
METRIC RATING
152nd/ 347
METRIC RANK
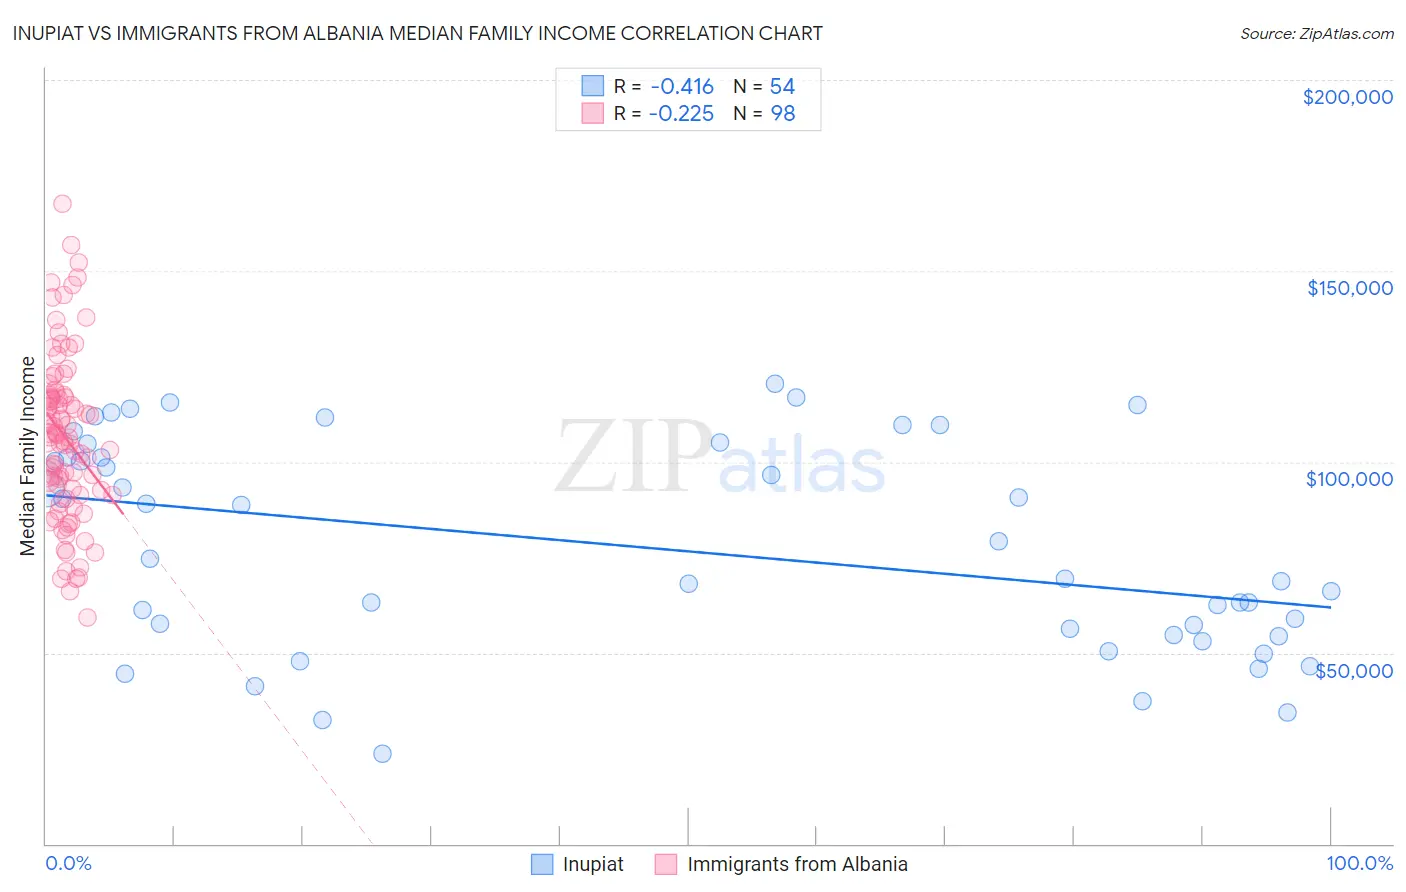
Inupiat vs Immigrants from Albania Median Family Income Correlation Chart
The statistical analysis conducted on geographies consisting of 96,309,592 people shows a moderate negative correlation between the proportion of Inupiat and median family income in the United States with a correlation coefficient (R) of -0.416 and weighted average of $91,730. Similarly, the statistical analysis conducted on geographies consisting of 119,337,318 people shows a weak negative correlation between the proportion of Immigrants from Albania and median family income in the United States with a correlation coefficient (R) of -0.225 and weighted average of $105,285, a difference of 14.8%.
Median Family Income Correlation Summary
| Measurement | Inupiat | Immigrants from Albania |
| Minimum | $23,690 | $59,250 |
| Maximum | $120,501 | $167,526 |
| Range | $96,811 | $108,276 |
| Mean | $77,500 | $106,367 |
| Median | $72,103 | $106,522 |
| Interquartile 25% (IQ1) | $54,583 | $91,250 |
| Interquartile 75% (IQ3) | $101,242 | $117,507 |
| Interquartile Range (IQR) | $46,659 | $26,257 |
| Standard Deviation (Sample) | $27,340 | $21,718 |
| Standard Deviation (Population) | $27,086 | $21,607 |
Similar Demographics by Median Family Income
Demographics Similar to Inupiat by Median Family Income
In terms of median family income, the demographic groups most similar to Inupiat are Liberian ($91,722, a difference of 0.010%), Pennsylvania German ($91,763, a difference of 0.040%), Cape Verdean ($91,848, a difference of 0.13%), Immigrants from West Indies ($91,588, a difference of 0.16%), and Osage ($91,926, a difference of 0.21%).
| Demographics | Rating | Rank | Median Family Income |
| Immigrants | Barbados | 0.5 /100 | #254 | Tragic $92,419 |
| Immigrants | Laos | 0.5 /100 | #255 | Tragic $92,239 |
| Nicaraguans | 0.5 /100 | #256 | Tragic $92,231 |
| Americans | 0.4 /100 | #257 | Tragic $92,096 |
| Osage | 0.4 /100 | #258 | Tragic $91,926 |
| Cape Verdeans | 0.4 /100 | #259 | Tragic $91,848 |
| Pennsylvania Germans | 0.4 /100 | #260 | Tragic $91,763 |
| Inupiat | 0.4 /100 | #261 | Tragic $91,730 |
| Liberians | 0.4 /100 | #262 | Tragic $91,722 |
| Immigrants | West Indies | 0.3 /100 | #263 | Tragic $91,588 |
| Senegalese | 0.3 /100 | #264 | Tragic $91,475 |
| Hmong | 0.3 /100 | #265 | Tragic $91,296 |
| Central Americans | 0.3 /100 | #266 | Tragic $91,087 |
| Mexican American Indians | 0.2 /100 | #267 | Tragic $90,918 |
| Cree | 0.2 /100 | #268 | Tragic $90,882 |
Demographics Similar to Immigrants from Albania by Median Family Income
In terms of median family income, the demographic groups most similar to Immigrants from Albania are Slavic ($105,144, a difference of 0.13%), Peruvian ($105,444, a difference of 0.15%), Irish ($105,453, a difference of 0.16%), Immigrants from Germany ($105,507, a difference of 0.21%), and Immigrants from Nepal ($104,966, a difference of 0.30%).
| Demographics | Rating | Rank | Median Family Income |
| Danes | 83.8 /100 | #145 | Excellent $105,900 |
| Czechs | 83.4 /100 | #146 | Excellent $105,839 |
| Immigrants | Chile | 82.1 /100 | #147 | Excellent $105,655 |
| Hungarians | 81.7 /100 | #148 | Excellent $105,609 |
| Immigrants | Germany | 80.9 /100 | #149 | Excellent $105,507 |
| Irish | 80.5 /100 | #150 | Excellent $105,453 |
| Peruvians | 80.4 /100 | #151 | Excellent $105,444 |
| Immigrants | Albania | 79.1 /100 | #152 | Good $105,285 |
| Slavs | 77.9 /100 | #153 | Good $105,144 |
| Immigrants | Nepal | 76.3 /100 | #154 | Good $104,966 |
| Native Hawaiians | 75.8 /100 | #155 | Good $104,910 |
| Basques | 74.4 /100 | #156 | Good $104,760 |
| Moroccans | 71.6 /100 | #157 | Good $104,488 |
| Scandinavians | 70.8 /100 | #158 | Good $104,410 |
| Swiss | 70.7 /100 | #159 | Good $104,396 |