Russian vs Immigrants from Austria Median Family Income
COMPARE
Russian
Immigrants from Austria
Median Family Income
Median Family Income Comparison
Russians
Immigrants from Austria
$120,487
MEDIAN FAMILY INCOME
100.0/ 100
METRIC RATING
27th/ 347
METRIC RANK
$116,830
MEDIAN FAMILY INCOME
99.9/ 100
METRIC RATING
47th/ 347
METRIC RANK
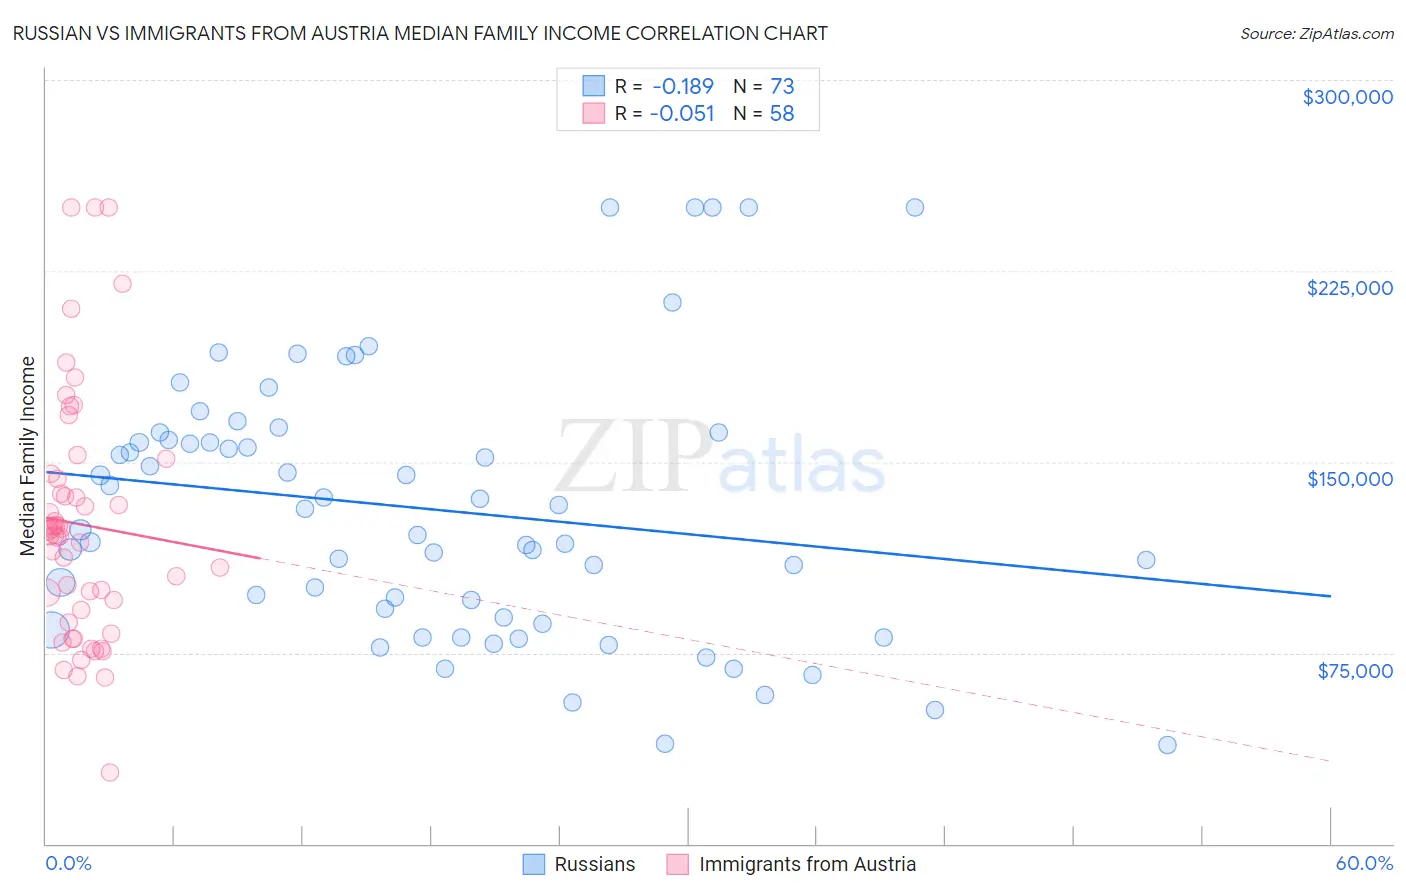
Russian vs Immigrants from Austria Median Family Income Correlation Chart
The statistical analysis conducted on geographies consisting of 511,404,289 people shows a poor negative correlation between the proportion of Russians and median family income in the United States with a correlation coefficient (R) of -0.189 and weighted average of $120,487. Similarly, the statistical analysis conducted on geographies consisting of 167,957,927 people shows a slight negative correlation between the proportion of Immigrants from Austria and median family income in the United States with a correlation coefficient (R) of -0.051 and weighted average of $116,830, a difference of 3.1%.
Median Family Income Correlation Summary
| Measurement | Russian | Immigrants from Austria |
| Minimum | $38,939 | $28,077 |
| Maximum | $250,001 | $250,001 |
| Range | $211,062 | $221,924 |
| Mean | $131,214 | $125,494 |
| Median | $123,457 | $122,176 |
| Interquartile 25% (IQ1) | $87,492 | $91,605 |
| Interquartile 75% (IQ3) | $160,004 | $143,362 |
| Interquartile Range (IQR) | $72,512 | $51,756 |
| Standard Deviation (Sample) | $52,364 | $47,633 |
| Standard Deviation (Population) | $52,005 | $47,221 |
Demographics Similar to Russians and Immigrants from Austria by Median Family Income
In terms of median family income, the demographic groups most similar to Russians are Immigrants from Denmark ($120,445, a difference of 0.040%), Latvian ($120,301, a difference of 0.15%), Immigrants from Sri Lanka ($120,263, a difference of 0.19%), Immigrants from France ($120,076, a difference of 0.34%), and Asian ($119,955, a difference of 0.44%). Similarly, the demographic groups most similar to Immigrants from Austria are Immigrants from Russia ($116,942, a difference of 0.10%), Immigrants from Greece ($117,344, a difference of 0.44%), Cambodian ($117,780, a difference of 0.81%), Bulgarian ($117,818, a difference of 0.85%), and Immigrants from Bolivia ($117,912, a difference of 0.93%).
| Demographics | Rating | Rank | Median Family Income |
| Russians | 100.0 /100 | #27 | Exceptional $120,487 |
| Immigrants | Denmark | 100.0 /100 | #28 | Exceptional $120,445 |
| Latvians | 100.0 /100 | #29 | Exceptional $120,301 |
| Immigrants | Sri Lanka | 100.0 /100 | #30 | Exceptional $120,263 |
| Immigrants | France | 100.0 /100 | #31 | Exceptional $120,076 |
| Asians | 100.0 /100 | #32 | Exceptional $119,955 |
| Bhutanese | 100.0 /100 | #33 | Exceptional $119,800 |
| Bolivians | 100.0 /100 | #34 | Exceptional $119,479 |
| Soviet Union | 100.0 /100 | #35 | Exceptional $119,262 |
| Israelis | 100.0 /100 | #36 | Exceptional $118,577 |
| Australians | 100.0 /100 | #37 | Exceptional $118,440 |
| Immigrants | Turkey | 100.0 /100 | #38 | Exceptional $118,325 |
| Immigrants | Asia | 100.0 /100 | #39 | Exceptional $118,291 |
| Immigrants | Lithuania | 100.0 /100 | #40 | Exceptional $118,053 |
| Estonians | 100.0 /100 | #41 | Exceptional $118,013 |
| Immigrants | Bolivia | 100.0 /100 | #42 | Exceptional $117,912 |
| Bulgarians | 100.0 /100 | #43 | Exceptional $117,818 |
| Cambodians | 100.0 /100 | #44 | Exceptional $117,780 |
| Immigrants | Greece | 99.9 /100 | #45 | Exceptional $117,344 |
| Immigrants | Russia | 99.9 /100 | #46 | Exceptional $116,942 |
| Immigrants | Austria | 99.9 /100 | #47 | Exceptional $116,830 |