Inupiat vs Spanish American Median Family Income
COMPARE
Inupiat
Spanish American
Median Family Income
Median Family Income Comparison
Inupiat
Spanish Americans
$91,730
MEDIAN FAMILY INCOME
0.4/ 100
METRIC RATING
261st/ 347
METRIC RANK
$90,322
MEDIAN FAMILY INCOME
0.2/ 100
METRIC RATING
274th/ 347
METRIC RANK
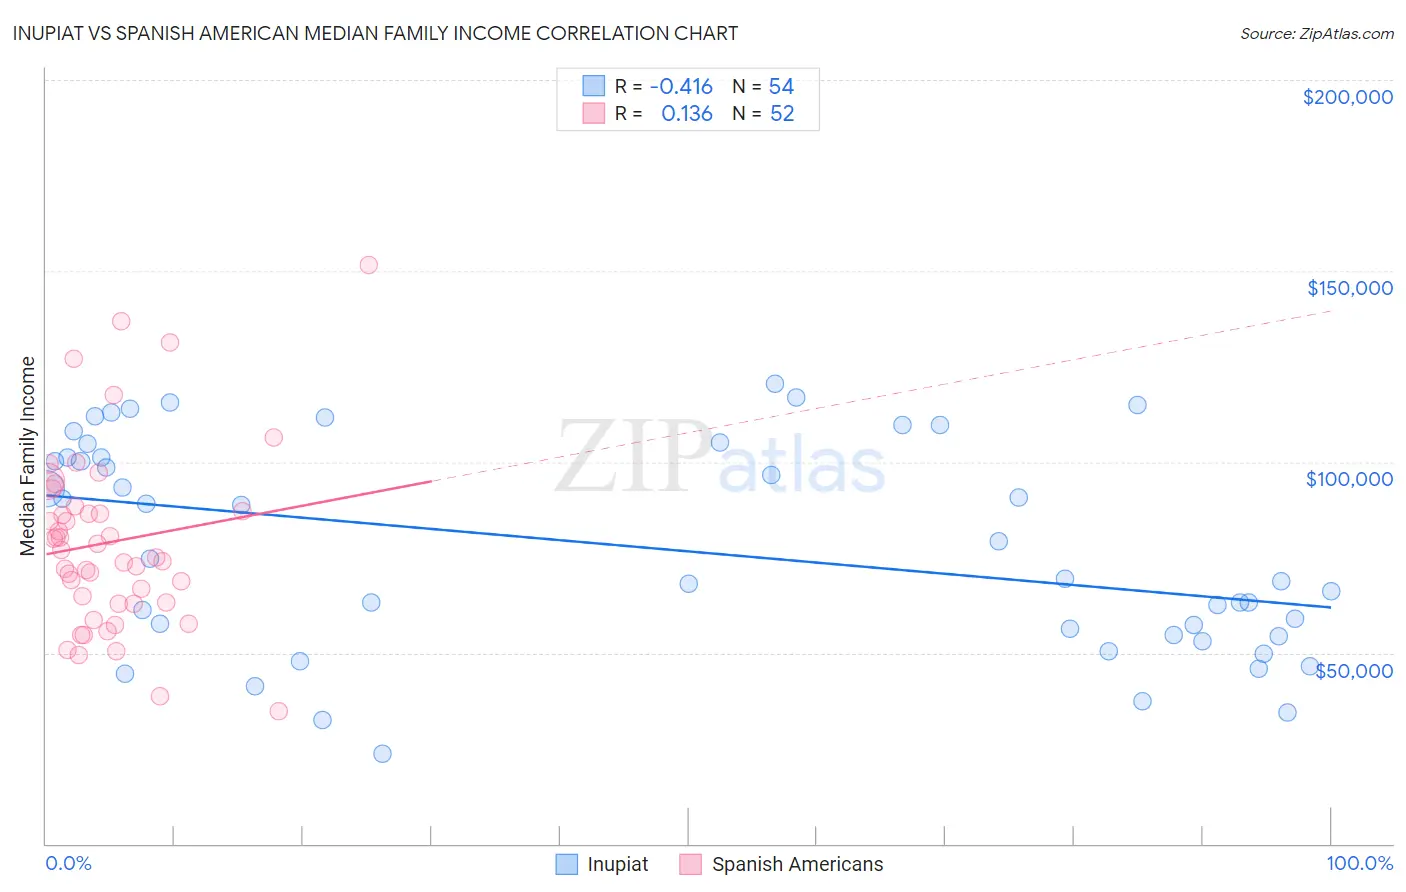
Inupiat vs Spanish American Median Family Income Correlation Chart
The statistical analysis conducted on geographies consisting of 96,309,592 people shows a moderate negative correlation between the proportion of Inupiat and median family income in the United States with a correlation coefficient (R) of -0.416 and weighted average of $91,730. Similarly, the statistical analysis conducted on geographies consisting of 103,155,631 people shows a poor positive correlation between the proportion of Spanish Americans and median family income in the United States with a correlation coefficient (R) of 0.136 and weighted average of $90,322, a difference of 1.6%.
Median Family Income Correlation Summary
| Measurement | Inupiat | Spanish American |
| Minimum | $23,690 | $34,804 |
| Maximum | $120,501 | $151,435 |
| Range | $96,811 | $116,631 |
| Mean | $77,500 | $79,090 |
| Median | $72,103 | $75,945 |
| Interquartile 25% (IQ1) | $54,583 | $62,996 |
| Interquartile 75% (IQ3) | $101,242 | $87,771 |
| Interquartile Range (IQR) | $46,659 | $24,775 |
| Standard Deviation (Sample) | $27,340 | $23,819 |
| Standard Deviation (Population) | $27,086 | $23,588 |
Demographics Similar to Inupiat and Spanish Americans by Median Family Income
In terms of median family income, the demographic groups most similar to Inupiat are Liberian ($91,722, a difference of 0.010%), Pennsylvania German ($91,763, a difference of 0.040%), Cape Verdean ($91,848, a difference of 0.13%), Immigrants from West Indies ($91,588, a difference of 0.16%), and Osage ($91,926, a difference of 0.21%). Similarly, the demographic groups most similar to Spanish Americans are Immigrants from Micronesia ($90,345, a difference of 0.020%), Immigrants from Liberia ($90,450, a difference of 0.14%), Iroquois ($90,543, a difference of 0.24%), Immigrants from St. Vincent and the Grenadines ($90,094, a difference of 0.25%), and Jamaican ($90,581, a difference of 0.29%).
| Demographics | Rating | Rank | Median Family Income |
| Americans | 0.4 /100 | #257 | Tragic $92,096 |
| Osage | 0.4 /100 | #258 | Tragic $91,926 |
| Cape Verdeans | 0.4 /100 | #259 | Tragic $91,848 |
| Pennsylvania Germans | 0.4 /100 | #260 | Tragic $91,763 |
| Inupiat | 0.4 /100 | #261 | Tragic $91,730 |
| Liberians | 0.4 /100 | #262 | Tragic $91,722 |
| Immigrants | West Indies | 0.3 /100 | #263 | Tragic $91,588 |
| Senegalese | 0.3 /100 | #264 | Tragic $91,475 |
| Hmong | 0.3 /100 | #265 | Tragic $91,296 |
| Central Americans | 0.3 /100 | #266 | Tragic $91,087 |
| Mexican American Indians | 0.2 /100 | #267 | Tragic $90,918 |
| Cree | 0.2 /100 | #268 | Tragic $90,882 |
| Belizeans | 0.2 /100 | #269 | Tragic $90,880 |
| Jamaicans | 0.2 /100 | #270 | Tragic $90,581 |
| Iroquois | 0.2 /100 | #271 | Tragic $90,543 |
| Immigrants | Liberia | 0.2 /100 | #272 | Tragic $90,450 |
| Immigrants | Micronesia | 0.2 /100 | #273 | Tragic $90,345 |
| Spanish Americans | 0.2 /100 | #274 | Tragic $90,322 |
| Immigrants | St. Vincent and the Grenadines | 0.2 /100 | #275 | Tragic $90,094 |
| Immigrants | Zaire | 0.1 /100 | #276 | Tragic $89,285 |
| Immigrants | Jamaica | 0.1 /100 | #277 | Tragic $89,268 |