Indonesian vs Ethiopian Median Male Earnings
COMPARE
Indonesian
Ethiopian
Median Male Earnings
Median Male Earnings Comparison
Indonesians
Ethiopians
$47,503
MEDIAN MALE EARNINGS
0.1/ 100
METRIC RATING
293rd/ 347
METRIC RANK
$56,243
MEDIAN MALE EARNINGS
84.8/ 100
METRIC RATING
142nd/ 347
METRIC RANK
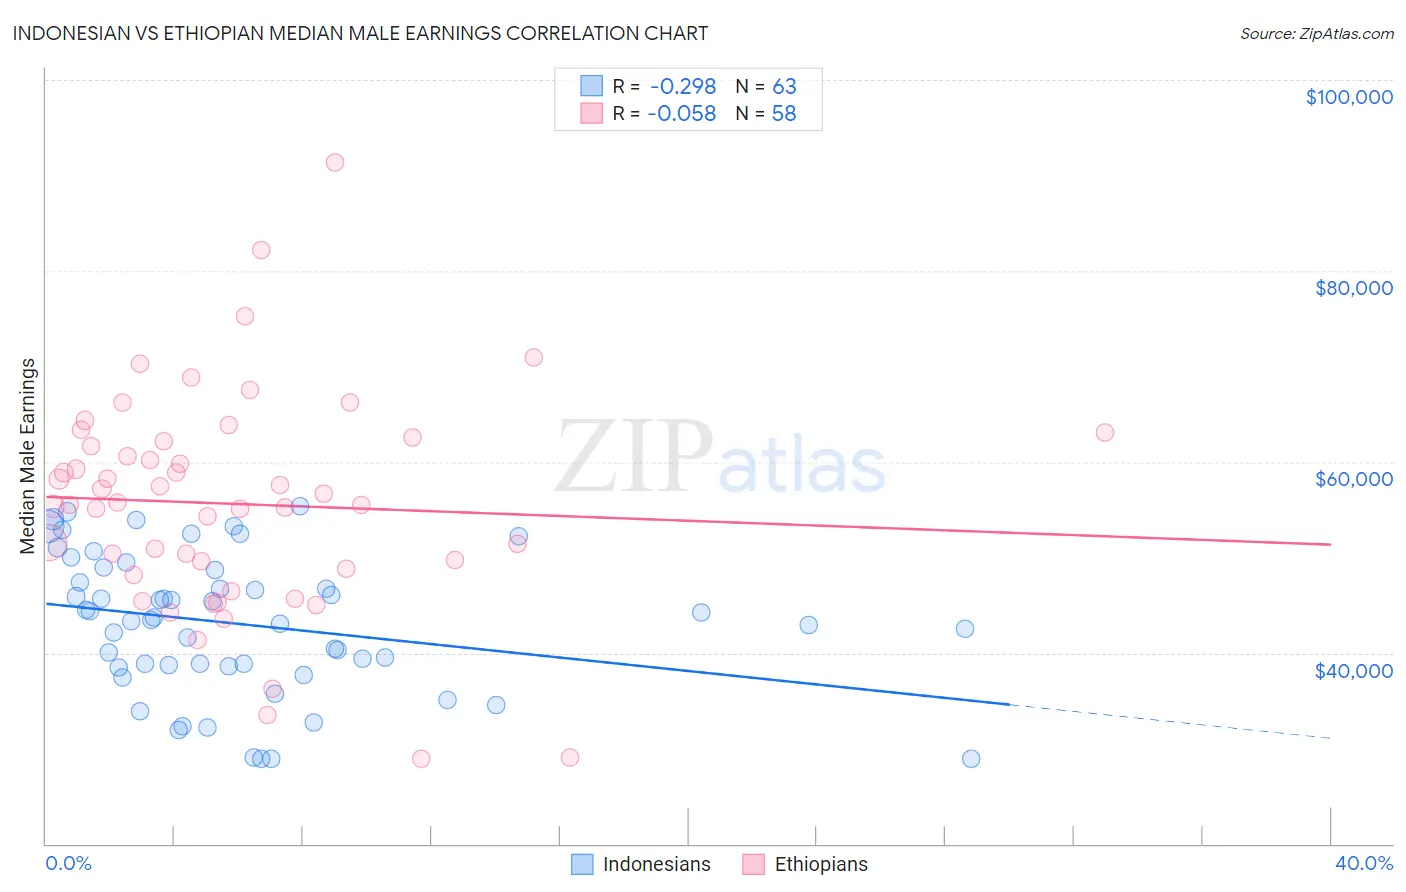
Indonesian vs Ethiopian Median Male Earnings Correlation Chart
The statistical analysis conducted on geographies consisting of 162,701,910 people shows a weak negative correlation between the proportion of Indonesians and median male earnings in the United States with a correlation coefficient (R) of -0.298 and weighted average of $47,503. Similarly, the statistical analysis conducted on geographies consisting of 223,246,505 people shows a slight negative correlation between the proportion of Ethiopians and median male earnings in the United States with a correlation coefficient (R) of -0.058 and weighted average of $56,243, a difference of 18.4%.
Median Male Earnings Correlation Summary
| Measurement | Indonesian | Ethiopian |
| Minimum | $28,857 | $28,882 |
| Maximum | $55,385 | $91,333 |
| Range | $26,528 | $62,451 |
| Mean | $42,970 | $55,598 |
| Median | $43,436 | $55,634 |
| Interquartile 25% (IQ1) | $38,534 | $48,793 |
| Interquartile 75% (IQ3) | $48,720 | $62,132 |
| Interquartile Range (IQR) | $10,186 | $13,339 |
| Standard Deviation (Sample) | $7,238 | $11,505 |
| Standard Deviation (Population) | $7,181 | $11,405 |
Similar Demographics by Median Male Earnings
Demographics Similar to Indonesians by Median Male Earnings
In terms of median male earnings, the demographic groups most similar to Indonesians are Immigrants from Nicaragua ($47,482, a difference of 0.040%), Central American Indian ($47,433, a difference of 0.15%), Immigrants from Dominica ($47,651, a difference of 0.31%), Inupiat ($47,281, a difference of 0.47%), and Choctaw ($47,729, a difference of 0.48%).
| Demographics | Rating | Rank | Median Male Earnings |
| Mexican American Indians | 0.2 /100 | #286 | Tragic $47,990 |
| Immigrants | El Salvador | 0.2 /100 | #287 | Tragic $47,973 |
| Shoshone | 0.2 /100 | #288 | Tragic $47,930 |
| Chickasaw | 0.1 /100 | #289 | Tragic $47,832 |
| Immigrants | Belize | 0.1 /100 | #290 | Tragic $47,809 |
| Choctaw | 0.1 /100 | #291 | Tragic $47,729 |
| Immigrants | Dominica | 0.1 /100 | #292 | Tragic $47,651 |
| Indonesians | 0.1 /100 | #293 | Tragic $47,503 |
| Immigrants | Nicaragua | 0.1 /100 | #294 | Tragic $47,482 |
| Central American Indians | 0.1 /100 | #295 | Tragic $47,433 |
| Inupiat | 0.1 /100 | #296 | Tragic $47,281 |
| Dominicans | 0.1 /100 | #297 | Tragic $47,204 |
| Immigrants | Micronesia | 0.1 /100 | #298 | Tragic $47,177 |
| Immigrants | Zaire | 0.1 /100 | #299 | Tragic $47,070 |
| U.S. Virgin Islanders | 0.1 /100 | #300 | Tragic $47,066 |
Demographics Similar to Ethiopians by Median Male Earnings
In terms of median male earnings, the demographic groups most similar to Ethiopians are Danish ($56,246, a difference of 0.0%), Zimbabwean ($56,302, a difference of 0.10%), Luxembourger ($56,300, a difference of 0.10%), Slovak ($56,306, a difference of 0.11%), and Sri Lankan ($56,136, a difference of 0.19%).
| Demographics | Rating | Rank | Median Male Earnings |
| Irish | 87.4 /100 | #135 | Excellent $56,464 |
| Immigrants | Saudi Arabia | 87.2 /100 | #136 | Excellent $56,452 |
| Slavs | 86.5 /100 | #137 | Excellent $56,390 |
| Slovaks | 85.5 /100 | #138 | Excellent $56,306 |
| Zimbabweans | 85.5 /100 | #139 | Excellent $56,302 |
| Luxembourgers | 85.5 /100 | #140 | Excellent $56,300 |
| Danes | 84.8 /100 | #141 | Excellent $56,246 |
| Ethiopians | 84.8 /100 | #142 | Excellent $56,243 |
| Sri Lankans | 83.4 /100 | #143 | Excellent $56,136 |
| Immigrants | Uganda | 82.4 /100 | #144 | Excellent $56,064 |
| Norwegians | 80.9 /100 | #145 | Excellent $55,965 |
| Immigrants | Chile | 80.7 /100 | #146 | Excellent $55,954 |
| Immigrants | Philippines | 78.4 /100 | #147 | Good $55,809 |
| Scottish | 78.2 /100 | #148 | Good $55,793 |
| English | 77.4 /100 | #149 | Good $55,747 |