Immigrants from St. Vincent and the Grenadines vs Immigrants from Zimbabwe Wage/Income Gap
COMPARE
Immigrants from St. Vincent and the Grenadines
Immigrants from Zimbabwe
Wage/Income Gap
Wage/Income Gap Comparison
Immigrants from St. Vincent and the Grenadines
Immigrants from Zimbabwe
16.4%
WAGE/INCOME GAP
100.0/ 100
METRIC RATING
2nd/ 347
METRIC RANK
25.3%
WAGE/INCOME GAP
73.7/ 100
METRIC RATING
158th/ 347
METRIC RANK
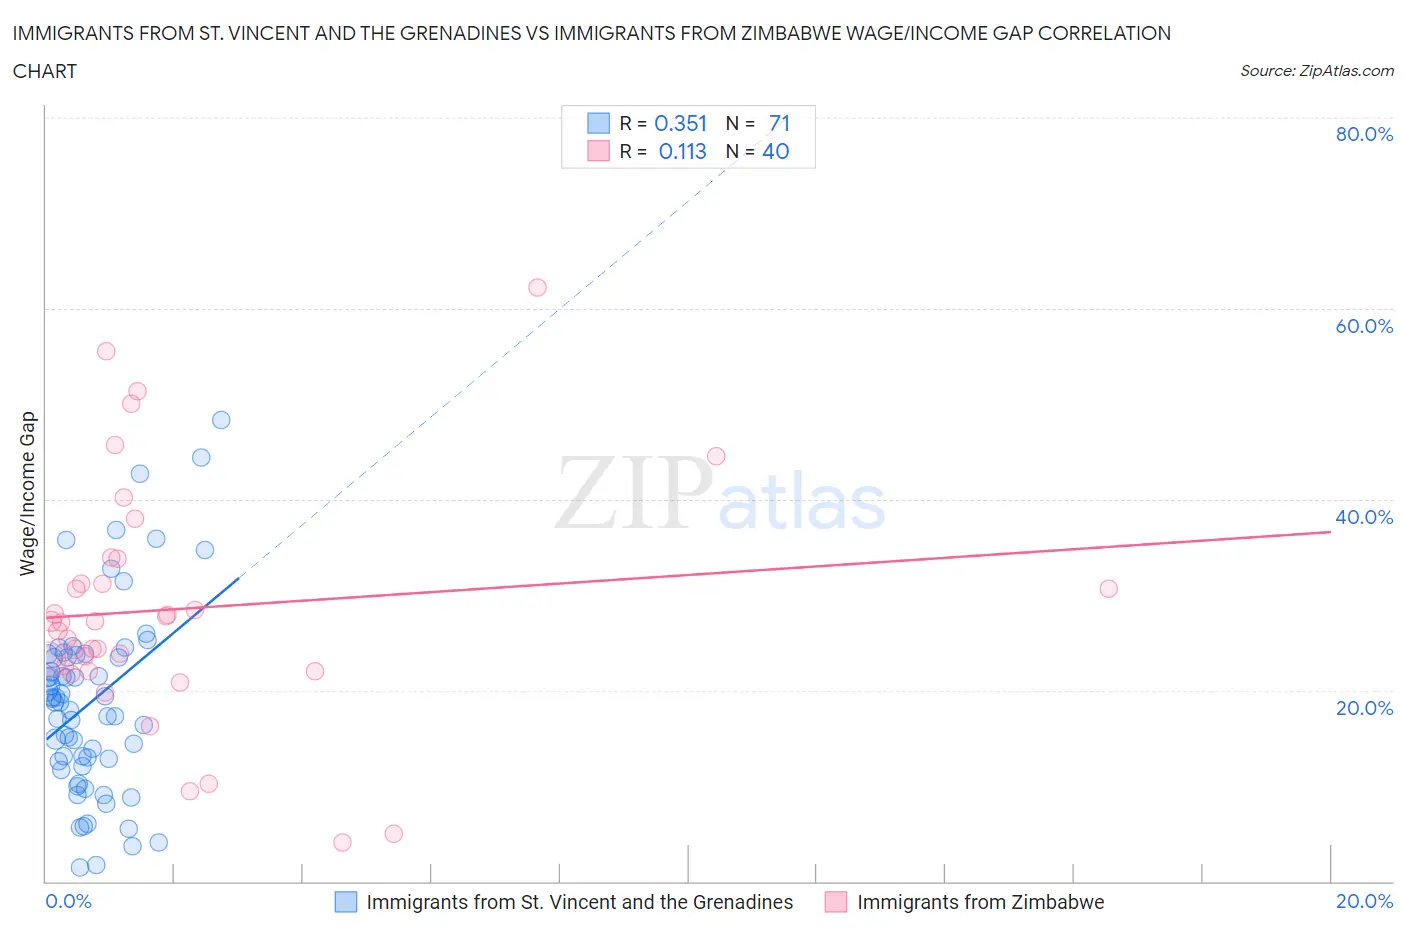
Immigrants from St. Vincent and the Grenadines vs Immigrants from Zimbabwe Wage/Income Gap Correlation Chart
The statistical analysis conducted on geographies consisting of 56,186,231 people shows a mild positive correlation between the proportion of Immigrants from St. Vincent and the Grenadines and wage/income gap percentage in the United States with a correlation coefficient (R) of 0.351 and weighted average of 16.4%. Similarly, the statistical analysis conducted on geographies consisting of 117,792,332 people shows a poor positive correlation between the proportion of Immigrants from Zimbabwe and wage/income gap percentage in the United States with a correlation coefficient (R) of 0.113 and weighted average of 25.3%, a difference of 54.3%.
Wage/Income Gap Correlation Summary
| Measurement | Immigrants from St. Vincent and the Grenadines | Immigrants from Zimbabwe |
| Minimum | 1.4% | 4.0% |
| Maximum | 48.3% | 62.1% |
| Range | 46.9% | 58.1% |
| Mean | 18.8% | 28.5% |
| Median | 18.8% | 27.1% |
| Interquartile 25% (IQ1) | 12.5% | 22.3% |
| Interquartile 75% (IQ3) | 23.7% | 32.5% |
| Interquartile Range (IQR) | 11.2% | 10.2% |
| Standard Deviation (Sample) | 9.8% | 12.6% |
| Standard Deviation (Population) | 9.8% | 12.4% |
Similar Demographics by Wage/Income Gap
Demographics Similar to Immigrants from St. Vincent and the Grenadines by Wage/Income Gap
In terms of wage/income gap, the demographic groups most similar to Immigrants from St. Vincent and the Grenadines are Immigrants from Grenada (16.2%, a difference of 1.5%), Immigrants from Barbados (17.8%, a difference of 8.6%), British West Indian (18.0%, a difference of 9.7%), Guyanese (18.3%, a difference of 11.5%), and Immigrants from Guyana (18.4%, a difference of 11.8%).
| Demographics | Rating | Rank | Wage/Income Gap |
| Immigrants | Grenada | 100.0 /100 | #1 | Exceptional 16.2% |
| Immigrants | St. Vincent and the Grenadines | 100.0 /100 | #2 | Exceptional 16.4% |
| Immigrants | Barbados | 100.0 /100 | #3 | Exceptional 17.8% |
| British West Indians | 100.0 /100 | #4 | Exceptional 18.0% |
| Guyanese | 100.0 /100 | #5 | Exceptional 18.3% |
| Immigrants | Guyana | 100.0 /100 | #6 | Exceptional 18.4% |
| Puerto Ricans | 100.0 /100 | #7 | Exceptional 18.7% |
| Immigrants | Jamaica | 100.0 /100 | #8 | Exceptional 18.8% |
| Barbadians | 100.0 /100 | #9 | Exceptional 19.0% |
| Crow | 100.0 /100 | #10 | Exceptional 19.1% |
| Immigrants | Haiti | 100.0 /100 | #11 | Exceptional 19.2% |
| Immigrants | West Indies | 100.0 /100 | #12 | Exceptional 19.2% |
| Trinidadians and Tobagonians | 100.0 /100 | #13 | Exceptional 19.3% |
| Immigrants | Trinidad and Tobago | 100.0 /100 | #14 | Exceptional 19.3% |
| West Indians | 100.0 /100 | #15 | Exceptional 19.6% |
Demographics Similar to Immigrants from Zimbabwe by Wage/Income Gap
In terms of wage/income gap, the demographic groups most similar to Immigrants from Zimbabwe are Puget Sound Salish (25.3%, a difference of 0.060%), French American Indian (25.4%, a difference of 0.10%), Costa Rican (25.3%, a difference of 0.18%), Immigrants from Mexico (25.3%, a difference of 0.24%), and Albanian (25.4%, a difference of 0.35%).
| Demographics | Rating | Rank | Wage/Income Gap |
| Taiwanese | 81.6 /100 | #151 | Excellent 25.1% |
| Uruguayans | 81.3 /100 | #152 | Excellent 25.2% |
| Blackfeet | 78.1 /100 | #153 | Good 25.2% |
| Immigrants | Northern Africa | 78.1 /100 | #154 | Good 25.2% |
| Immigrants | Vietnam | 77.7 /100 | #155 | Good 25.2% |
| Immigrants | Mexico | 76.4 /100 | #156 | Good 25.3% |
| Costa Ricans | 75.8 /100 | #157 | Good 25.3% |
| Immigrants | Zimbabwe | 73.7 /100 | #158 | Good 25.3% |
| Puget Sound Salish | 73.0 /100 | #159 | Good 25.3% |
| French American Indians | 72.5 /100 | #160 | Good 25.4% |
| Albanians | 69.4 /100 | #161 | Good 25.4% |
| Shoshone | 69.0 /100 | #162 | Good 25.4% |
| Native Hawaiians | 69.0 /100 | #163 | Good 25.4% |
| Koreans | 68.6 /100 | #164 | Good 25.4% |
| Immigrants | Hong Kong | 64.0 /100 | #165 | Good 25.5% |