Immigrants from St. Vincent and the Grenadines vs South African Wage/Income Gap
COMPARE
Immigrants from St. Vincent and the Grenadines
South African
Wage/Income Gap
Wage/Income Gap Comparison
Immigrants from St. Vincent and the Grenadines
South Africans
16.4%
WAGE/INCOME GAP
100.0/ 100
METRIC RATING
2nd/ 347
METRIC RANK
28.0%
WAGE/INCOME GAP
0.5/ 100
METRIC RATING
282nd/ 347
METRIC RANK
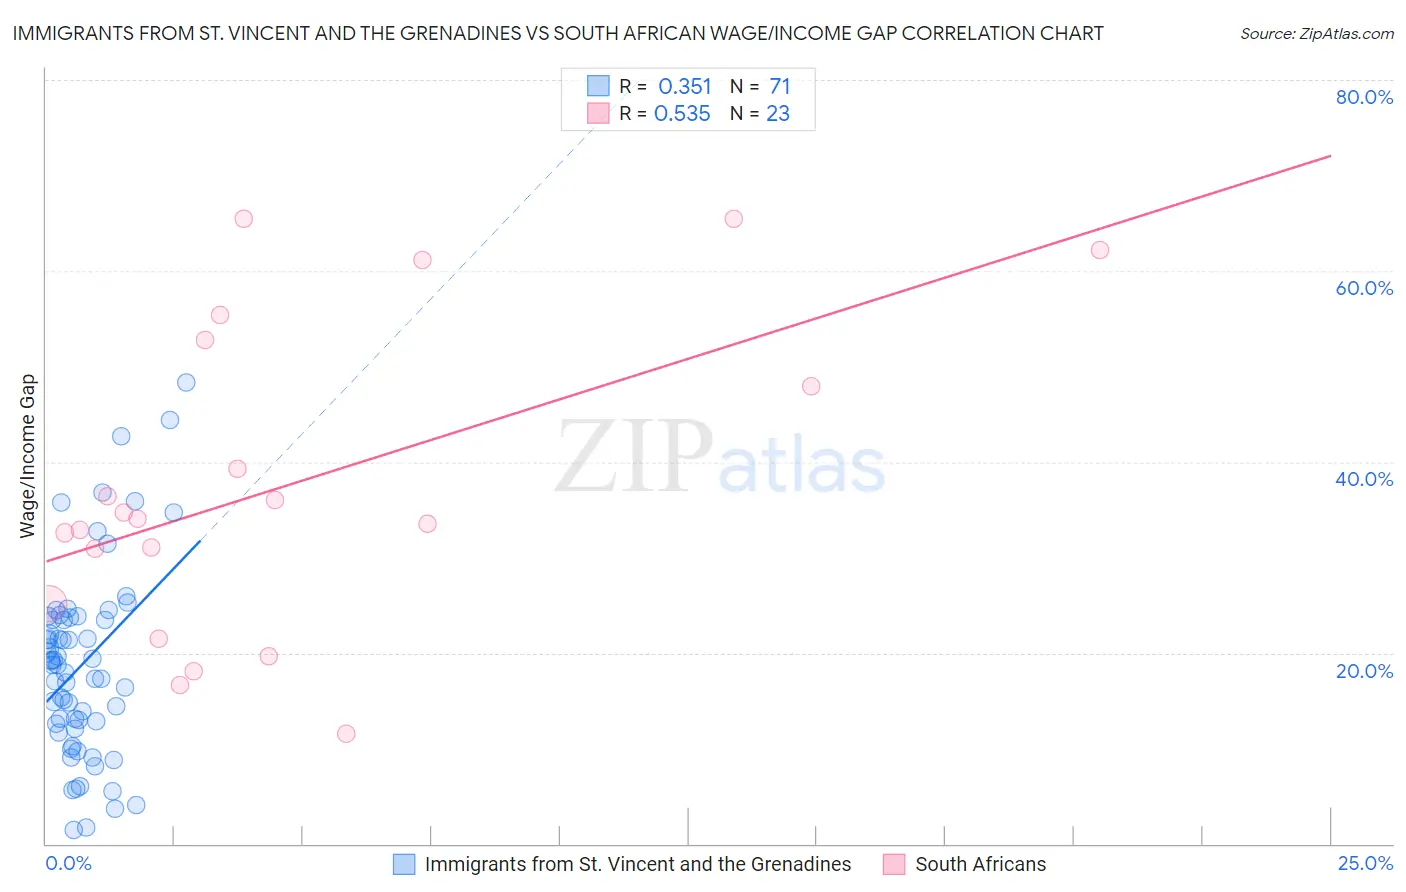
Immigrants from St. Vincent and the Grenadines vs South African Wage/Income Gap Correlation Chart
The statistical analysis conducted on geographies consisting of 56,186,231 people shows a mild positive correlation between the proportion of Immigrants from St. Vincent and the Grenadines and wage/income gap percentage in the United States with a correlation coefficient (R) of 0.351 and weighted average of 16.4%. Similarly, the statistical analysis conducted on geographies consisting of 182,544,146 people shows a substantial positive correlation between the proportion of South Africans and wage/income gap percentage in the United States with a correlation coefficient (R) of 0.535 and weighted average of 28.0%, a difference of 70.7%.
Wage/Income Gap Correlation Summary
| Measurement | Immigrants from St. Vincent and the Grenadines | South African |
| Minimum | 1.4% | 11.5% |
| Maximum | 48.3% | 65.5% |
| Range | 46.9% | 54.0% |
| Mean | 18.8% | 37.6% |
| Median | 18.8% | 34.0% |
| Interquartile 25% (IQ1) | 12.5% | 25.1% |
| Interquartile 75% (IQ3) | 23.7% | 52.7% |
| Interquartile Range (IQR) | 11.2% | 27.6% |
| Standard Deviation (Sample) | 9.8% | 16.2% |
| Standard Deviation (Population) | 9.8% | 15.9% |
Similar Demographics by Wage/Income Gap
Demographics Similar to Immigrants from St. Vincent and the Grenadines by Wage/Income Gap
In terms of wage/income gap, the demographic groups most similar to Immigrants from St. Vincent and the Grenadines are Immigrants from Grenada (16.2%, a difference of 1.5%), Immigrants from Barbados (17.8%, a difference of 8.6%), British West Indian (18.0%, a difference of 9.7%), Guyanese (18.3%, a difference of 11.5%), and Immigrants from Guyana (18.4%, a difference of 11.8%).
| Demographics | Rating | Rank | Wage/Income Gap |
| Immigrants | Grenada | 100.0 /100 | #1 | Exceptional 16.2% |
| Immigrants | St. Vincent and the Grenadines | 100.0 /100 | #2 | Exceptional 16.4% |
| Immigrants | Barbados | 100.0 /100 | #3 | Exceptional 17.8% |
| British West Indians | 100.0 /100 | #4 | Exceptional 18.0% |
| Guyanese | 100.0 /100 | #5 | Exceptional 18.3% |
| Immigrants | Guyana | 100.0 /100 | #6 | Exceptional 18.4% |
| Puerto Ricans | 100.0 /100 | #7 | Exceptional 18.7% |
| Immigrants | Jamaica | 100.0 /100 | #8 | Exceptional 18.8% |
| Barbadians | 100.0 /100 | #9 | Exceptional 19.0% |
| Crow | 100.0 /100 | #10 | Exceptional 19.1% |
| Immigrants | Haiti | 100.0 /100 | #11 | Exceptional 19.2% |
| Immigrants | West Indies | 100.0 /100 | #12 | Exceptional 19.2% |
| Trinidadians and Tobagonians | 100.0 /100 | #13 | Exceptional 19.3% |
| Immigrants | Trinidad and Tobago | 100.0 /100 | #14 | Exceptional 19.3% |
| West Indians | 100.0 /100 | #15 | Exceptional 19.6% |
Demographics Similar to South Africans by Wage/Income Gap
In terms of wage/income gap, the demographic groups most similar to South Africans are Burmese (28.0%, a difference of 0.030%), Russian (28.0%, a difference of 0.080%), French Canadian (28.1%, a difference of 0.18%), Immigrants from Sweden (28.1%, a difference of 0.18%), and Romanian (28.0%, a difference of 0.23%).
| Demographics | Rating | Rank | Wage/Income Gap |
| Immigrants | Japan | 0.7 /100 | #275 | Tragic 27.9% |
| Lebanese | 0.7 /100 | #276 | Tragic 27.9% |
| Latvians | 0.7 /100 | #277 | Tragic 27.9% |
| Immigrants | England | 0.6 /100 | #278 | Tragic 27.9% |
| Romanians | 0.5 /100 | #279 | Tragic 28.0% |
| Russians | 0.5 /100 | #280 | Tragic 28.0% |
| Burmese | 0.5 /100 | #281 | Tragic 28.0% |
| South Africans | 0.5 /100 | #282 | Tragic 28.0% |
| French Canadians | 0.4 /100 | #283 | Tragic 28.1% |
| Immigrants | Sweden | 0.4 /100 | #284 | Tragic 28.1% |
| Italians | 0.4 /100 | #285 | Tragic 28.1% |
| Immigrants | Austria | 0.4 /100 | #286 | Tragic 28.1% |
| Okinawans | 0.4 /100 | #287 | Tragic 28.1% |
| Choctaw | 0.4 /100 | #288 | Tragic 28.1% |
| Canadians | 0.3 /100 | #289 | Tragic 28.1% |