Immigrants from St. Vincent and the Grenadines vs Immigrants from Zimbabwe Householder Income Ages 25 - 44 years
COMPARE
Immigrants from St. Vincent and the Grenadines
Immigrants from Zimbabwe
Householder Income Ages 25 - 44 years
Householder Income Ages 25 - 44 years Comparison
Immigrants from St. Vincent and the Grenadines
Immigrants from Zimbabwe
$88,888
HOUSEHOLDER INCOME AGES 25 - 44 YEARS
4.1/ 100
METRIC RATING
227th/ 347
METRIC RANK
$97,880
HOUSEHOLDER INCOME AGES 25 - 44 YEARS
86.3/ 100
METRIC RATING
132nd/ 347
METRIC RANK
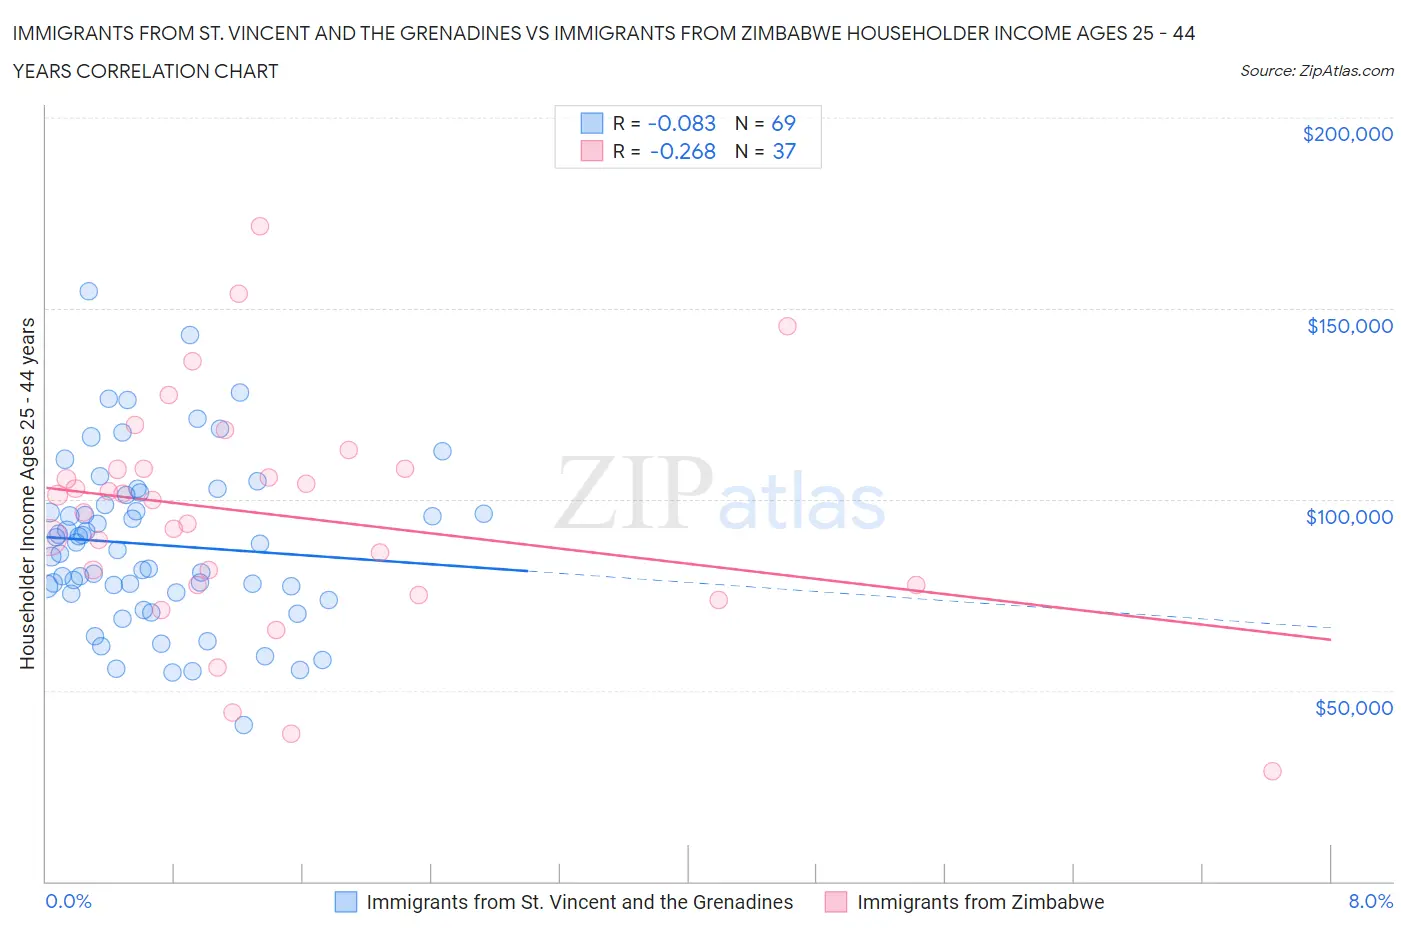
Immigrants from St. Vincent and the Grenadines vs Immigrants from Zimbabwe Householder Income Ages 25 - 44 years Correlation Chart
The statistical analysis conducted on geographies consisting of 56,178,565 people shows a slight negative correlation between the proportion of Immigrants from St. Vincent and the Grenadines and household income with householder between the ages 25 and 44 in the United States with a correlation coefficient (R) of -0.083 and weighted average of $88,888. Similarly, the statistical analysis conducted on geographies consisting of 117,746,283 people shows a weak negative correlation between the proportion of Immigrants from Zimbabwe and household income with householder between the ages 25 and 44 in the United States with a correlation coefficient (R) of -0.268 and weighted average of $97,880, a difference of 10.1%.
Householder Income Ages 25 - 44 years Correlation Summary
| Measurement | Immigrants from St. Vincent and the Grenadines | Immigrants from Zimbabwe |
| Minimum | $40,942 | $28,895 |
| Maximum | $154,470 | $171,540 |
| Range | $113,528 | $142,645 |
| Mean | $88,106 | $95,961 |
| Median | $86,685 | $99,716 |
| Interquartile 25% (IQ1) | $75,335 | $77,685 |
| Interquartile 75% (IQ3) | $99,794 | $107,912 |
| Interquartile Range (IQR) | $24,459 | $30,227 |
| Standard Deviation (Sample) | $21,933 | $29,842 |
| Standard Deviation (Population) | $21,773 | $29,436 |
Similar Demographics by Householder Income Ages 25 - 44 years
Demographics Similar to Immigrants from St. Vincent and the Grenadines by Householder Income Ages 25 - 44 years
In terms of householder income ages 25 - 44 years, the demographic groups most similar to Immigrants from St. Vincent and the Grenadines are Immigrants from Bosnia and Herzegovina ($88,819, a difference of 0.080%), Immigrants from Barbados ($88,687, a difference of 0.23%), Alaskan Athabascan ($88,446, a difference of 0.50%), Immigrants from Iraq ($89,444, a difference of 0.62%), and Immigrants from Panama ($89,451, a difference of 0.63%).
| Demographics | Rating | Rank | Householder Income Ages 25 - 44 years |
| Trinidadians and Tobagonians | 6.8 /100 | #220 | Tragic $89,856 |
| Immigrants | Trinidad and Tobago | 6.5 /100 | #221 | Tragic $89,748 |
| Immigrants | Ecuador | 6.2 /100 | #222 | Tragic $89,673 |
| Immigrants | Guyana | 5.9 /100 | #223 | Tragic $89,586 |
| Barbadians | 5.9 /100 | #224 | Tragic $89,565 |
| Immigrants | Panama | 5.5 /100 | #225 | Tragic $89,451 |
| Immigrants | Iraq | 5.5 /100 | #226 | Tragic $89,444 |
| Immigrants | St. Vincent and the Grenadines | 4.1 /100 | #227 | Tragic $88,888 |
| Immigrants | Bosnia and Herzegovina | 4.0 /100 | #228 | Tragic $88,819 |
| Immigrants | Barbados | 3.7 /100 | #229 | Tragic $88,687 |
| Alaskan Athabascans | 3.3 /100 | #230 | Tragic $88,446 |
| Immigrants | Grenada | 3.0 /100 | #231 | Tragic $88,311 |
| Immigrants | Nonimmigrants | 3.0 /100 | #232 | Tragic $88,301 |
| Malaysians | 3.0 /100 | #233 | Tragic $88,291 |
| Venezuelans | 2.9 /100 | #234 | Tragic $88,232 |
Demographics Similar to Immigrants from Zimbabwe by Householder Income Ages 25 - 44 years
In terms of householder income ages 25 - 44 years, the demographic groups most similar to Immigrants from Zimbabwe are Immigrants from Albania ($97,929, a difference of 0.050%), Tsimshian ($97,809, a difference of 0.070%), Immigrants from Kuwait ($98,122, a difference of 0.25%), Canadian ($97,625, a difference of 0.26%), and Immigrants from Oceania ($97,623, a difference of 0.26%).
| Demographics | Rating | Rank | Householder Income Ages 25 - 44 years |
| Pakistanis | 89.3 /100 | #125 | Excellent $98,401 |
| British | 89.1 /100 | #126 | Excellent $98,359 |
| Serbians | 88.9 /100 | #127 | Excellent $98,320 |
| Europeans | 88.9 /100 | #128 | Excellent $98,310 |
| Brazilians | 88.6 /100 | #129 | Excellent $98,267 |
| Immigrants | Kuwait | 87.8 /100 | #130 | Excellent $98,122 |
| Immigrants | Albania | 86.6 /100 | #131 | Excellent $97,929 |
| Immigrants | Zimbabwe | 86.3 /100 | #132 | Excellent $97,880 |
| Tsimshian | 85.8 /100 | #133 | Excellent $97,809 |
| Canadians | 84.5 /100 | #134 | Excellent $97,625 |
| Immigrants | Oceania | 84.5 /100 | #135 | Excellent $97,623 |
| Hungarians | 83.9 /100 | #136 | Excellent $97,544 |
| Lebanese | 82.3 /100 | #137 | Excellent $97,339 |
| Arabs | 82.3 /100 | #138 | Excellent $97,336 |
| Immigrants | Peru | 82.2 /100 | #139 | Excellent $97,329 |