Immigrants from St. Vincent and the Grenadines vs Immigrants from Korea Householder Income Ages 25 - 44 years
COMPARE
Immigrants from St. Vincent and the Grenadines
Immigrants from Korea
Householder Income Ages 25 - 44 years
Householder Income Ages 25 - 44 years Comparison
Immigrants from St. Vincent and the Grenadines
Immigrants from Korea
$88,888
HOUSEHOLDER INCOME AGES 25 - 44 YEARS
4.1/ 100
METRIC RATING
227th/ 347
METRIC RANK
$113,401
HOUSEHOLDER INCOME AGES 25 - 44 YEARS
100.0/ 100
METRIC RATING
20th/ 347
METRIC RANK
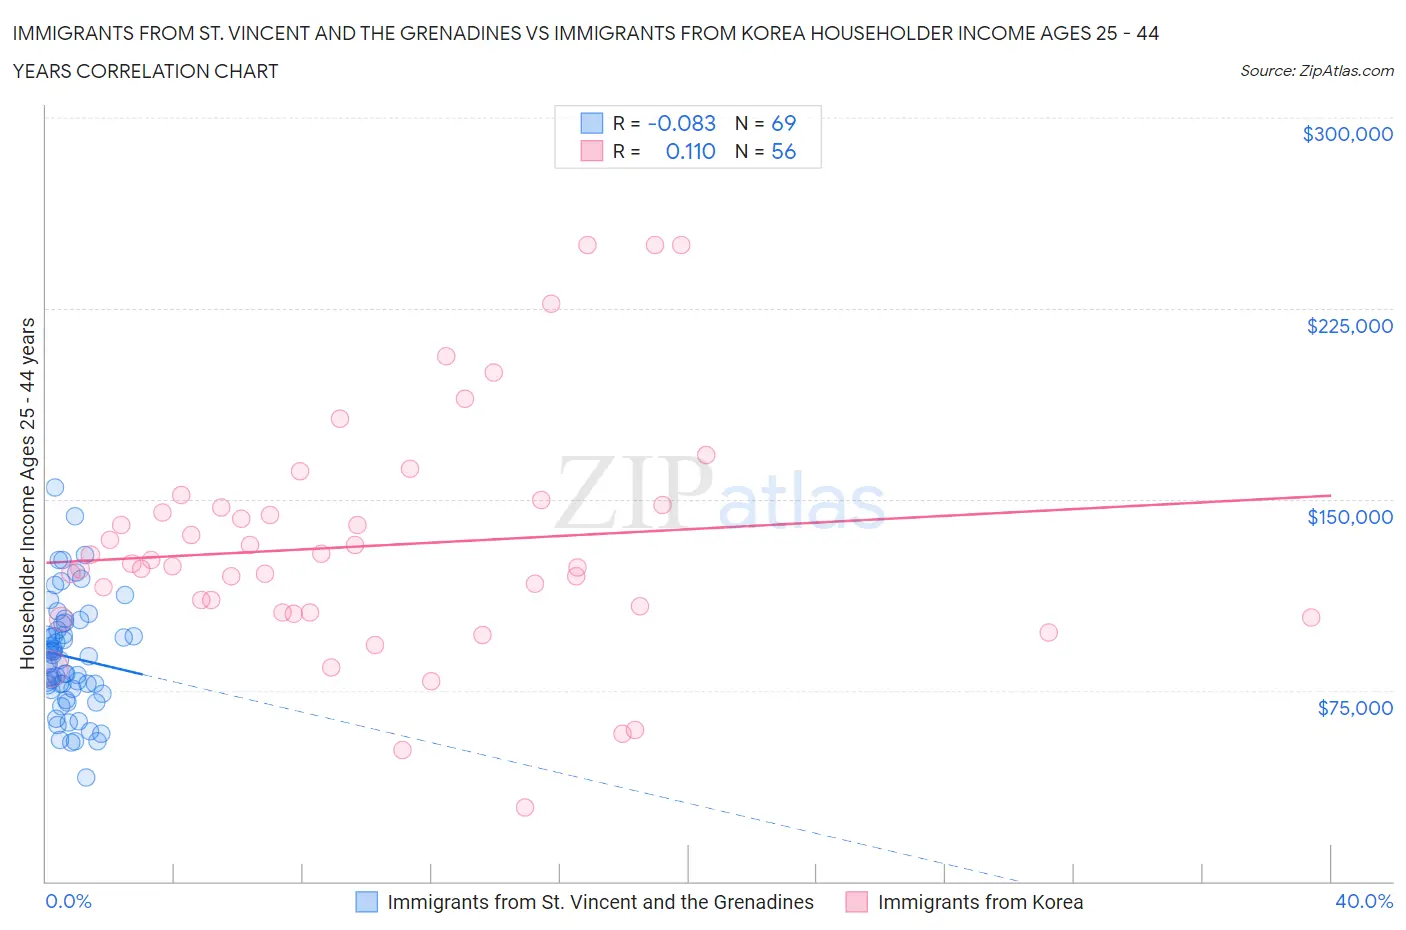
Immigrants from St. Vincent and the Grenadines vs Immigrants from Korea Householder Income Ages 25 - 44 years Correlation Chart
The statistical analysis conducted on geographies consisting of 56,178,565 people shows a slight negative correlation between the proportion of Immigrants from St. Vincent and the Grenadines and household income with householder between the ages 25 and 44 in the United States with a correlation coefficient (R) of -0.083 and weighted average of $88,888. Similarly, the statistical analysis conducted on geographies consisting of 415,166,266 people shows a poor positive correlation between the proportion of Immigrants from Korea and household income with householder between the ages 25 and 44 in the United States with a correlation coefficient (R) of 0.110 and weighted average of $113,401, a difference of 27.6%.
Householder Income Ages 25 - 44 years Correlation Summary
| Measurement | Immigrants from St. Vincent and the Grenadines | Immigrants from Korea |
| Minimum | $40,942 | $29,000 |
| Maximum | $154,470 | $250,001 |
| Range | $113,528 | $221,001 |
| Mean | $88,106 | $131,830 |
| Median | $86,685 | $124,193 |
| Interquartile 25% (IQ1) | $75,335 | $105,598 |
| Interquartile 75% (IQ3) | $99,794 | $147,331 |
| Interquartile Range (IQR) | $24,459 | $41,733 |
| Standard Deviation (Sample) | $21,933 | $46,184 |
| Standard Deviation (Population) | $21,773 | $45,770 |
Similar Demographics by Householder Income Ages 25 - 44 years
Demographics Similar to Immigrants from St. Vincent and the Grenadines by Householder Income Ages 25 - 44 years
In terms of householder income ages 25 - 44 years, the demographic groups most similar to Immigrants from St. Vincent and the Grenadines are Immigrants from Bosnia and Herzegovina ($88,819, a difference of 0.080%), Immigrants from Barbados ($88,687, a difference of 0.23%), Alaskan Athabascan ($88,446, a difference of 0.50%), Immigrants from Iraq ($89,444, a difference of 0.62%), and Immigrants from Panama ($89,451, a difference of 0.63%).
| Demographics | Rating | Rank | Householder Income Ages 25 - 44 years |
| Trinidadians and Tobagonians | 6.8 /100 | #220 | Tragic $89,856 |
| Immigrants | Trinidad and Tobago | 6.5 /100 | #221 | Tragic $89,748 |
| Immigrants | Ecuador | 6.2 /100 | #222 | Tragic $89,673 |
| Immigrants | Guyana | 5.9 /100 | #223 | Tragic $89,586 |
| Barbadians | 5.9 /100 | #224 | Tragic $89,565 |
| Immigrants | Panama | 5.5 /100 | #225 | Tragic $89,451 |
| Immigrants | Iraq | 5.5 /100 | #226 | Tragic $89,444 |
| Immigrants | St. Vincent and the Grenadines | 4.1 /100 | #227 | Tragic $88,888 |
| Immigrants | Bosnia and Herzegovina | 4.0 /100 | #228 | Tragic $88,819 |
| Immigrants | Barbados | 3.7 /100 | #229 | Tragic $88,687 |
| Alaskan Athabascans | 3.3 /100 | #230 | Tragic $88,446 |
| Immigrants | Grenada | 3.0 /100 | #231 | Tragic $88,311 |
| Immigrants | Nonimmigrants | 3.0 /100 | #232 | Tragic $88,301 |
| Malaysians | 3.0 /100 | #233 | Tragic $88,291 |
| Venezuelans | 2.9 /100 | #234 | Tragic $88,232 |
Demographics Similar to Immigrants from Korea by Householder Income Ages 25 - 44 years
In terms of householder income ages 25 - 44 years, the demographic groups most similar to Immigrants from Korea are Burmese ($113,701, a difference of 0.26%), Asian ($112,666, a difference of 0.65%), Immigrants from Belgium ($112,575, a difference of 0.73%), Eastern European ($114,523, a difference of 0.99%), and Immigrants from Japan ($112,228, a difference of 1.1%).
| Demographics | Rating | Rank | Householder Income Ages 25 - 44 years |
| Immigrants | Eastern Asia | 100.0 /100 | #13 | Exceptional $118,056 |
| Immigrants | Israel | 100.0 /100 | #14 | Exceptional $117,219 |
| Immigrants | South Central Asia | 100.0 /100 | #15 | Exceptional $116,626 |
| Cypriots | 100.0 /100 | #16 | Exceptional $116,364 |
| Immigrants | Australia | 100.0 /100 | #17 | Exceptional $115,947 |
| Eastern Europeans | 100.0 /100 | #18 | Exceptional $114,523 |
| Burmese | 100.0 /100 | #19 | Exceptional $113,701 |
| Immigrants | Korea | 100.0 /100 | #20 | Exceptional $113,401 |
| Asians | 100.0 /100 | #21 | Exceptional $112,666 |
| Immigrants | Belgium | 100.0 /100 | #22 | Exceptional $112,575 |
| Immigrants | Japan | 100.0 /100 | #23 | Exceptional $112,228 |
| Immigrants | Sweden | 100.0 /100 | #24 | Exceptional $112,010 |
| Immigrants | Northern Europe | 100.0 /100 | #25 | Exceptional $111,676 |
| Immigrants | Asia | 100.0 /100 | #26 | Exceptional $110,787 |
| Russians | 100.0 /100 | #27 | Exceptional $110,398 |