Immigrants from St. Vincent and the Grenadines vs Slovak Householder Income Ages 25 - 44 years
COMPARE
Immigrants from St. Vincent and the Grenadines
Slovak
Householder Income Ages 25 - 44 years
Householder Income Ages 25 - 44 years Comparison
Immigrants from St. Vincent and the Grenadines
Slovaks
$88,888
HOUSEHOLDER INCOME AGES 25 - 44 YEARS
4.1/ 100
METRIC RATING
227th/ 347
METRIC RANK
$95,032
HOUSEHOLDER INCOME AGES 25 - 44 YEARS
56.4/ 100
METRIC RATING
170th/ 347
METRIC RANK
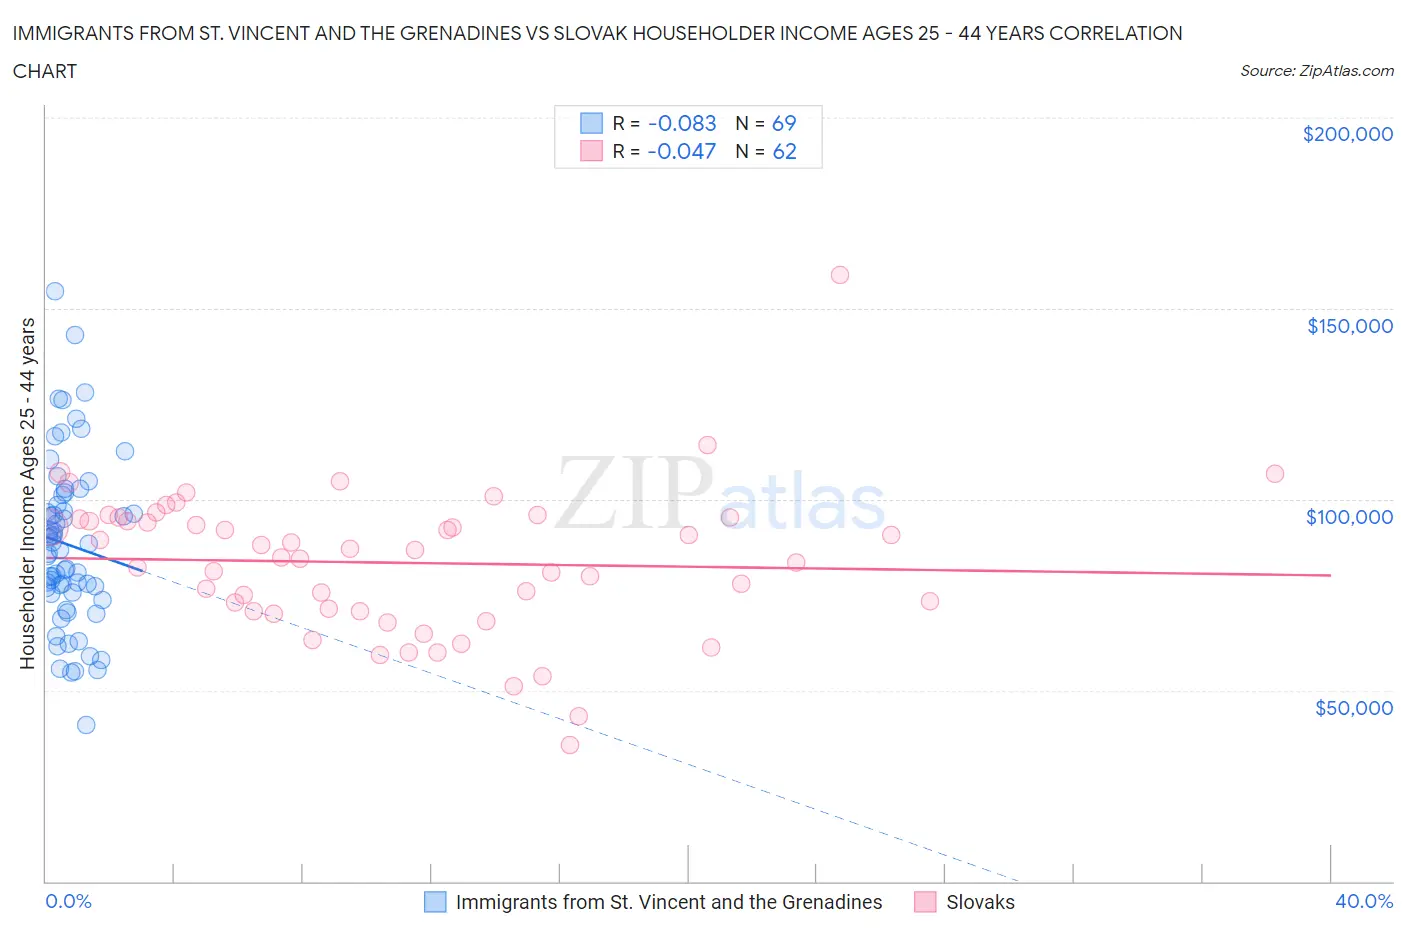
Immigrants from St. Vincent and the Grenadines vs Slovak Householder Income Ages 25 - 44 years Correlation Chart
The statistical analysis conducted on geographies consisting of 56,178,565 people shows a slight negative correlation between the proportion of Immigrants from St. Vincent and the Grenadines and household income with householder between the ages 25 and 44 in the United States with a correlation coefficient (R) of -0.083 and weighted average of $88,888. Similarly, the statistical analysis conducted on geographies consisting of 396,481,004 people shows no correlation between the proportion of Slovaks and household income with householder between the ages 25 and 44 in the United States with a correlation coefficient (R) of -0.047 and weighted average of $95,032, a difference of 6.9%.
Householder Income Ages 25 - 44 years Correlation Summary
| Measurement | Immigrants from St. Vincent and the Grenadines | Slovak |
| Minimum | $40,942 | $35,806 |
| Maximum | $154,470 | $158,804 |
| Range | $113,528 | $122,998 |
| Mean | $88,106 | $83,438 |
| Median | $86,685 | $85,825 |
| Interquartile 25% (IQ1) | $75,335 | $70,673 |
| Interquartile 75% (IQ3) | $99,794 | $94,793 |
| Interquartile Range (IQR) | $24,459 | $24,121 |
| Standard Deviation (Sample) | $21,933 | $19,171 |
| Standard Deviation (Population) | $21,773 | $19,016 |
Similar Demographics by Householder Income Ages 25 - 44 years
Demographics Similar to Immigrants from St. Vincent and the Grenadines by Householder Income Ages 25 - 44 years
In terms of householder income ages 25 - 44 years, the demographic groups most similar to Immigrants from St. Vincent and the Grenadines are Immigrants from Bosnia and Herzegovina ($88,819, a difference of 0.080%), Immigrants from Barbados ($88,687, a difference of 0.23%), Alaskan Athabascan ($88,446, a difference of 0.50%), Immigrants from Iraq ($89,444, a difference of 0.62%), and Immigrants from Panama ($89,451, a difference of 0.63%).
| Demographics | Rating | Rank | Householder Income Ages 25 - 44 years |
| Trinidadians and Tobagonians | 6.8 /100 | #220 | Tragic $89,856 |
| Immigrants | Trinidad and Tobago | 6.5 /100 | #221 | Tragic $89,748 |
| Immigrants | Ecuador | 6.2 /100 | #222 | Tragic $89,673 |
| Immigrants | Guyana | 5.9 /100 | #223 | Tragic $89,586 |
| Barbadians | 5.9 /100 | #224 | Tragic $89,565 |
| Immigrants | Panama | 5.5 /100 | #225 | Tragic $89,451 |
| Immigrants | Iraq | 5.5 /100 | #226 | Tragic $89,444 |
| Immigrants | St. Vincent and the Grenadines | 4.1 /100 | #227 | Tragic $88,888 |
| Immigrants | Bosnia and Herzegovina | 4.0 /100 | #228 | Tragic $88,819 |
| Immigrants | Barbados | 3.7 /100 | #229 | Tragic $88,687 |
| Alaskan Athabascans | 3.3 /100 | #230 | Tragic $88,446 |
| Immigrants | Grenada | 3.0 /100 | #231 | Tragic $88,311 |
| Immigrants | Nonimmigrants | 3.0 /100 | #232 | Tragic $88,301 |
| Malaysians | 3.0 /100 | #233 | Tragic $88,291 |
| Venezuelans | 2.9 /100 | #234 | Tragic $88,232 |
Demographics Similar to Slovaks by Householder Income Ages 25 - 44 years
In terms of householder income ages 25 - 44 years, the demographic groups most similar to Slovaks are Alsatian ($95,059, a difference of 0.030%), Native Hawaiian ($95,058, a difference of 0.030%), Czechoslovakian ($95,070, a difference of 0.040%), Immigrants from Armenia ($94,867, a difference of 0.17%), and Immigrants from Ethiopia ($95,256, a difference of 0.23%).
| Demographics | Rating | Rank | Householder Income Ages 25 - 44 years |
| Immigrants | Saudi Arabia | 62.0 /100 | #163 | Good $95,450 |
| South Americans | 60.9 /100 | #164 | Good $95,362 |
| Immigrants | Nepal | 60.3 /100 | #165 | Good $95,322 |
| Immigrants | Ethiopia | 59.5 /100 | #166 | Average $95,256 |
| Czechoslovakians | 57.0 /100 | #167 | Average $95,070 |
| Alsatians | 56.8 /100 | #168 | Average $95,059 |
| Native Hawaiians | 56.8 /100 | #169 | Average $95,058 |
| Slovaks | 56.4 /100 | #170 | Average $95,032 |
| Immigrants | Armenia | 54.2 /100 | #171 | Average $94,867 |
| Scottish | 50.8 /100 | #172 | Average $94,622 |
| Finns | 50.6 /100 | #173 | Average $94,610 |
| Colombians | 50.0 /100 | #174 | Average $94,565 |
| English | 48.1 /100 | #175 | Average $94,429 |
| Immigrants | Immigrants | 48.0 /100 | #176 | Average $94,423 |
| Belgians | 45.8 /100 | #177 | Average $94,262 |