Immigrants from St. Vincent and the Grenadines vs Immigrants from Latvia Householder Income Ages 25 - 44 years
COMPARE
Immigrants from St. Vincent and the Grenadines
Immigrants from Latvia
Householder Income Ages 25 - 44 years
Householder Income Ages 25 - 44 years Comparison
Immigrants from St. Vincent and the Grenadines
Immigrants from Latvia
$88,888
HOUSEHOLDER INCOME AGES 25 - 44 YEARS
4.1/ 100
METRIC RATING
227th/ 347
METRIC RANK
$105,522
HOUSEHOLDER INCOME AGES 25 - 44 YEARS
99.8/ 100
METRIC RATING
59th/ 347
METRIC RANK
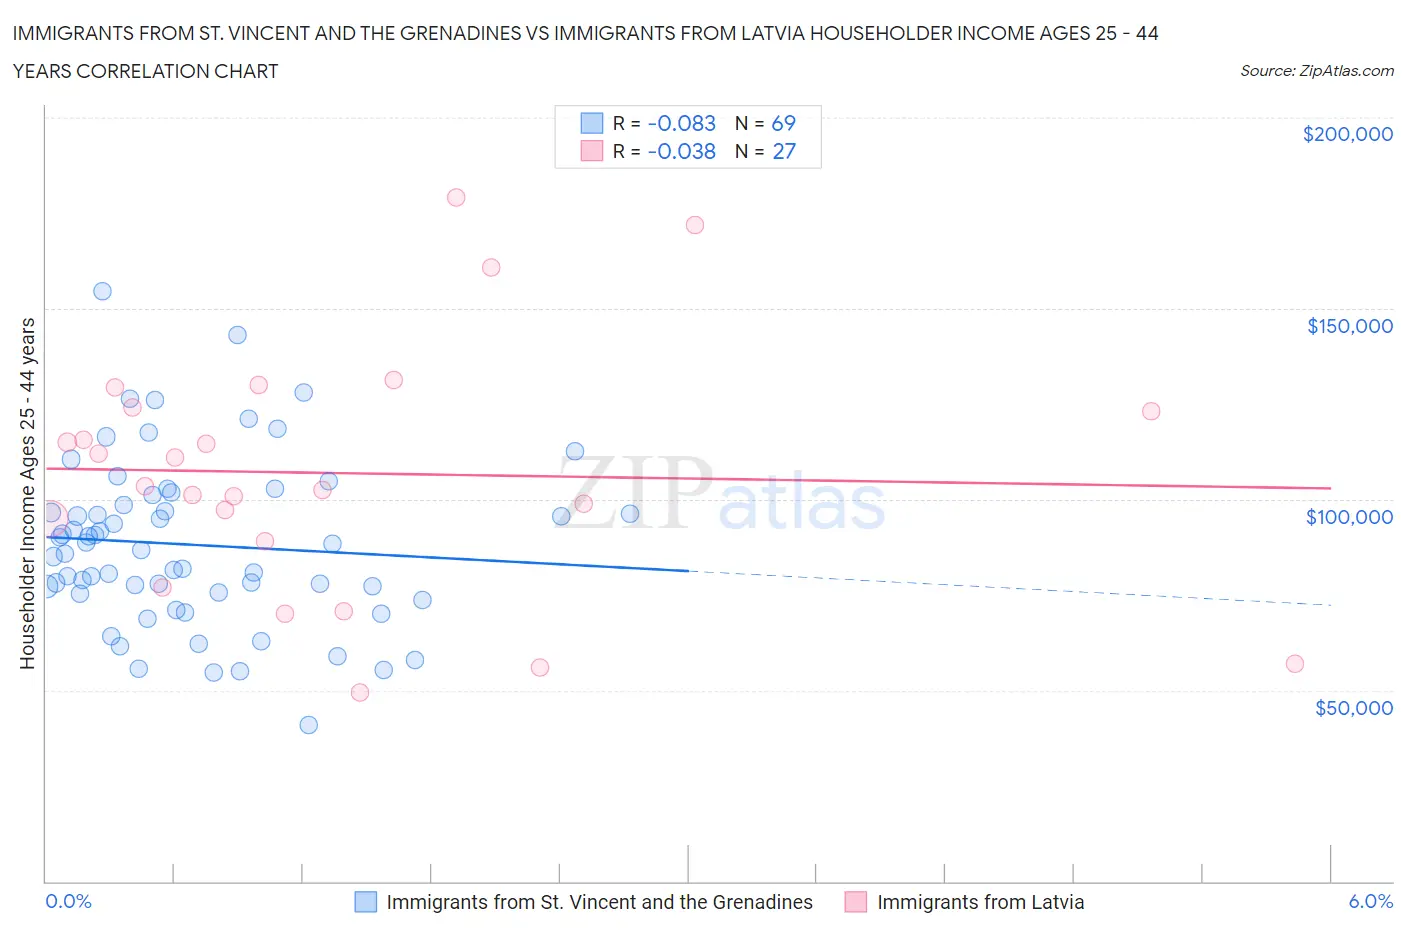
Immigrants from St. Vincent and the Grenadines vs Immigrants from Latvia Householder Income Ages 25 - 44 years Correlation Chart
The statistical analysis conducted on geographies consisting of 56,178,565 people shows a slight negative correlation between the proportion of Immigrants from St. Vincent and the Grenadines and household income with householder between the ages 25 and 44 in the United States with a correlation coefficient (R) of -0.083 and weighted average of $88,888. Similarly, the statistical analysis conducted on geographies consisting of 113,654,346 people shows no correlation between the proportion of Immigrants from Latvia and household income with householder between the ages 25 and 44 in the United States with a correlation coefficient (R) of -0.038 and weighted average of $105,522, a difference of 18.7%.
Householder Income Ages 25 - 44 years Correlation Summary
| Measurement | Immigrants from St. Vincent and the Grenadines | Immigrants from Latvia |
| Minimum | $40,942 | $49,566 |
| Maximum | $154,470 | $179,160 |
| Range | $113,528 | $129,594 |
| Mean | $88,106 | $106,849 |
| Median | $86,685 | $103,593 |
| Interquartile 25% (IQ1) | $75,335 | $88,894 |
| Interquartile 75% (IQ3) | $99,794 | $124,010 |
| Interquartile Range (IQR) | $24,459 | $35,116 |
| Standard Deviation (Sample) | $21,933 | $32,483 |
| Standard Deviation (Population) | $21,773 | $31,876 |
Similar Demographics by Householder Income Ages 25 - 44 years
Demographics Similar to Immigrants from St. Vincent and the Grenadines by Householder Income Ages 25 - 44 years
In terms of householder income ages 25 - 44 years, the demographic groups most similar to Immigrants from St. Vincent and the Grenadines are Immigrants from Bosnia and Herzegovina ($88,819, a difference of 0.080%), Immigrants from Barbados ($88,687, a difference of 0.23%), Alaskan Athabascan ($88,446, a difference of 0.50%), Immigrants from Iraq ($89,444, a difference of 0.62%), and Immigrants from Panama ($89,451, a difference of 0.63%).
| Demographics | Rating | Rank | Householder Income Ages 25 - 44 years |
| Trinidadians and Tobagonians | 6.8 /100 | #220 | Tragic $89,856 |
| Immigrants | Trinidad and Tobago | 6.5 /100 | #221 | Tragic $89,748 |
| Immigrants | Ecuador | 6.2 /100 | #222 | Tragic $89,673 |
| Immigrants | Guyana | 5.9 /100 | #223 | Tragic $89,586 |
| Barbadians | 5.9 /100 | #224 | Tragic $89,565 |
| Immigrants | Panama | 5.5 /100 | #225 | Tragic $89,451 |
| Immigrants | Iraq | 5.5 /100 | #226 | Tragic $89,444 |
| Immigrants | St. Vincent and the Grenadines | 4.1 /100 | #227 | Tragic $88,888 |
| Immigrants | Bosnia and Herzegovina | 4.0 /100 | #228 | Tragic $88,819 |
| Immigrants | Barbados | 3.7 /100 | #229 | Tragic $88,687 |
| Alaskan Athabascans | 3.3 /100 | #230 | Tragic $88,446 |
| Immigrants | Grenada | 3.0 /100 | #231 | Tragic $88,311 |
| Immigrants | Nonimmigrants | 3.0 /100 | #232 | Tragic $88,301 |
| Malaysians | 3.0 /100 | #233 | Tragic $88,291 |
| Venezuelans | 2.9 /100 | #234 | Tragic $88,232 |
Demographics Similar to Immigrants from Latvia by Householder Income Ages 25 - 44 years
In terms of householder income ages 25 - 44 years, the demographic groups most similar to Immigrants from Latvia are Immigrants from South Africa ($105,748, a difference of 0.21%), Egyptian ($105,282, a difference of 0.23%), Lithuanian ($105,223, a difference of 0.28%), Immigrants from Italy ($105,201, a difference of 0.31%), and Immigrants from Scotland ($105,089, a difference of 0.41%).
| Demographics | Rating | Rank | Householder Income Ages 25 - 44 years |
| Immigrants | Europe | 99.9 /100 | #52 | Exceptional $106,817 |
| Immigrants | Norway | 99.9 /100 | #53 | Exceptional $106,629 |
| Paraguayans | 99.9 /100 | #54 | Exceptional $106,615 |
| Greeks | 99.9 /100 | #55 | Exceptional $106,457 |
| Immigrants | Pakistan | 99.8 /100 | #56 | Exceptional $106,129 |
| Immigrants | Austria | 99.8 /100 | #57 | Exceptional $106,103 |
| Immigrants | South Africa | 99.8 /100 | #58 | Exceptional $105,748 |
| Immigrants | Latvia | 99.8 /100 | #59 | Exceptional $105,522 |
| Egyptians | 99.7 /100 | #60 | Exceptional $105,282 |
| Lithuanians | 99.7 /100 | #61 | Exceptional $105,223 |
| Immigrants | Italy | 99.7 /100 | #62 | Exceptional $105,201 |
| Immigrants | Scotland | 99.7 /100 | #63 | Exceptional $105,089 |
| New Zealanders | 99.7 /100 | #64 | Exceptional $105,085 |
| Immigrants | Netherlands | 99.7 /100 | #65 | Exceptional $105,082 |
| Laotians | 99.7 /100 | #66 | Exceptional $104,993 |