British West Indian vs Immigrants from Latvia Householder Income Ages 25 - 44 years
COMPARE
British West Indian
Immigrants from Latvia
Householder Income Ages 25 - 44 years
Householder Income Ages 25 - 44 years Comparison
British West Indians
Immigrants from Latvia
$85,565
HOUSEHOLDER INCOME AGES 25 - 44 YEARS
0.7/ 100
METRIC RATING
253rd/ 347
METRIC RANK
$105,522
HOUSEHOLDER INCOME AGES 25 - 44 YEARS
99.8/ 100
METRIC RATING
59th/ 347
METRIC RANK
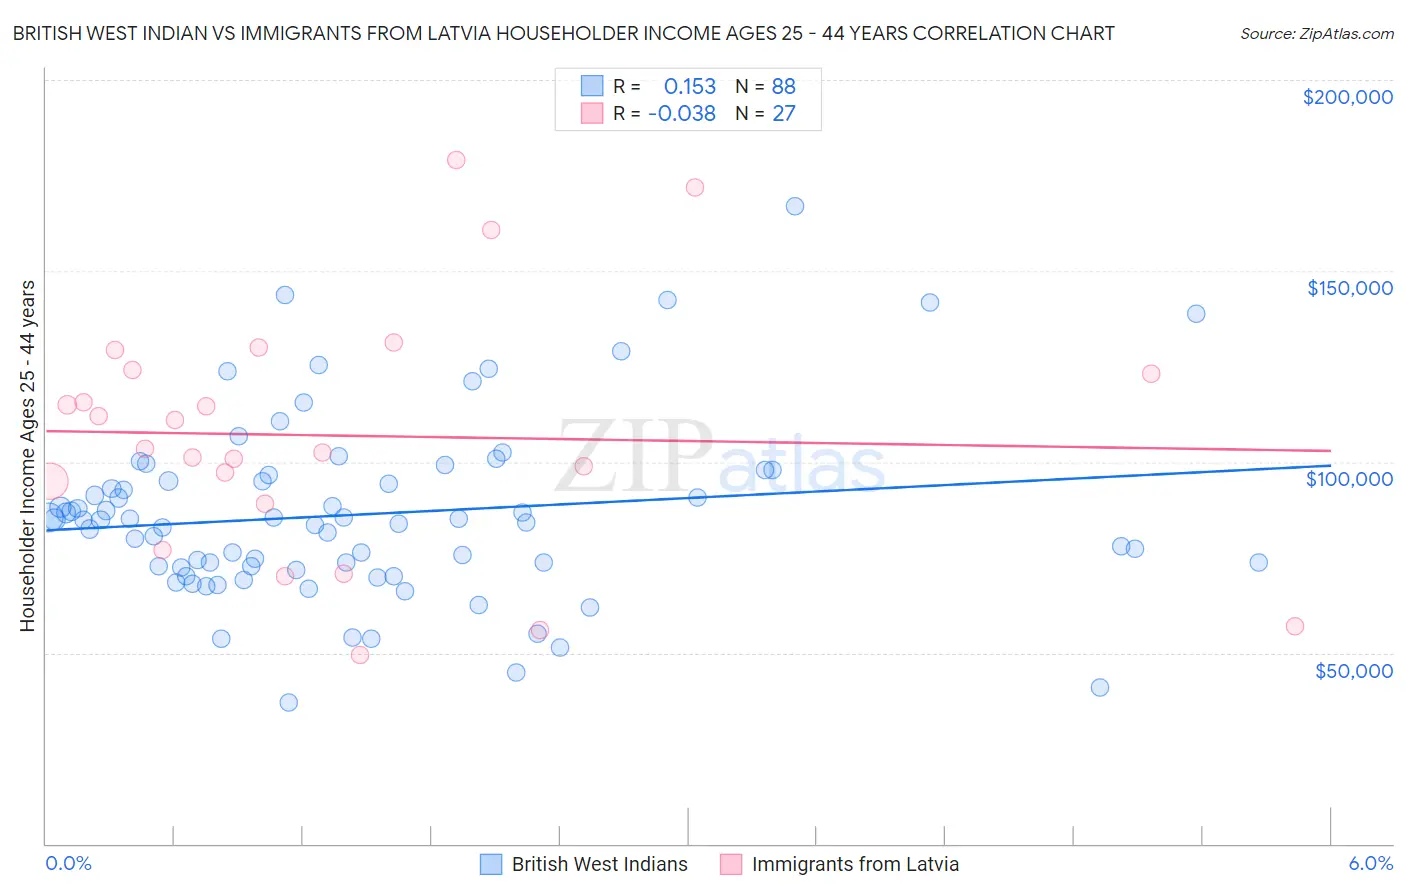
British West Indian vs Immigrants from Latvia Householder Income Ages 25 - 44 years Correlation Chart
The statistical analysis conducted on geographies consisting of 152,560,295 people shows a poor positive correlation between the proportion of British West Indians and household income with householder between the ages 25 and 44 in the United States with a correlation coefficient (R) of 0.153 and weighted average of $85,565. Similarly, the statistical analysis conducted on geographies consisting of 113,654,346 people shows no correlation between the proportion of Immigrants from Latvia and household income with householder between the ages 25 and 44 in the United States with a correlation coefficient (R) of -0.038 and weighted average of $105,522, a difference of 23.3%.
Householder Income Ages 25 - 44 years Correlation Summary
| Measurement | British West Indian | Immigrants from Latvia |
| Minimum | $36,830 | $49,566 |
| Maximum | $167,054 | $179,160 |
| Range | $130,224 | $129,594 |
| Mean | $86,302 | $106,849 |
| Median | $84,792 | $103,593 |
| Interquartile 25% (IQ1) | $72,493 | $88,894 |
| Interquartile 75% (IQ3) | $95,723 | $124,010 |
| Interquartile Range (IQR) | $23,230 | $35,116 |
| Standard Deviation (Sample) | $23,581 | $32,483 |
| Standard Deviation (Population) | $23,446 | $31,876 |
Similar Demographics by Householder Income Ages 25 - 44 years
Demographics Similar to British West Indians by Householder Income Ages 25 - 44 years
In terms of householder income ages 25 - 44 years, the demographic groups most similar to British West Indians are Immigrants from Laos ($85,553, a difference of 0.010%), Immigrants from Western Africa ($85,676, a difference of 0.13%), Cape Verdean ($85,758, a difference of 0.23%), Pennsylvania German ($85,836, a difference of 0.32%), and French American Indian ($85,899, a difference of 0.39%).
| Demographics | Rating | Rank | Householder Income Ages 25 - 44 years |
| Immigrants | Burma/Myanmar | 1.3 /100 | #246 | Tragic $86,736 |
| Immigrants | Nigeria | 1.2 /100 | #247 | Tragic $86,589 |
| Immigrants | Sudan | 0.9 /100 | #248 | Tragic $86,109 |
| French American Indians | 0.8 /100 | #249 | Tragic $85,899 |
| Pennsylvania Germans | 0.8 /100 | #250 | Tragic $85,836 |
| Cape Verdeans | 0.8 /100 | #251 | Tragic $85,758 |
| Immigrants | Western Africa | 0.7 /100 | #252 | Tragic $85,676 |
| British West Indians | 0.7 /100 | #253 | Tragic $85,565 |
| Immigrants | Laos | 0.7 /100 | #254 | Tragic $85,553 |
| German Russians | 0.6 /100 | #255 | Tragic $85,220 |
| Central Americans | 0.5 /100 | #256 | Tragic $85,144 |
| Mexican American Indians | 0.5 /100 | #257 | Tragic $85,066 |
| Immigrants | Nicaragua | 0.5 /100 | #258 | Tragic $84,914 |
| Immigrants | Senegal | 0.5 /100 | #259 | Tragic $84,848 |
| Americans | 0.4 /100 | #260 | Tragic $84,791 |
Demographics Similar to Immigrants from Latvia by Householder Income Ages 25 - 44 years
In terms of householder income ages 25 - 44 years, the demographic groups most similar to Immigrants from Latvia are Immigrants from South Africa ($105,748, a difference of 0.21%), Egyptian ($105,282, a difference of 0.23%), Lithuanian ($105,223, a difference of 0.28%), Immigrants from Italy ($105,201, a difference of 0.31%), and Immigrants from Scotland ($105,089, a difference of 0.41%).
| Demographics | Rating | Rank | Householder Income Ages 25 - 44 years |
| Immigrants | Europe | 99.9 /100 | #52 | Exceptional $106,817 |
| Immigrants | Norway | 99.9 /100 | #53 | Exceptional $106,629 |
| Paraguayans | 99.9 /100 | #54 | Exceptional $106,615 |
| Greeks | 99.9 /100 | #55 | Exceptional $106,457 |
| Immigrants | Pakistan | 99.8 /100 | #56 | Exceptional $106,129 |
| Immigrants | Austria | 99.8 /100 | #57 | Exceptional $106,103 |
| Immigrants | South Africa | 99.8 /100 | #58 | Exceptional $105,748 |
| Immigrants | Latvia | 99.8 /100 | #59 | Exceptional $105,522 |
| Egyptians | 99.7 /100 | #60 | Exceptional $105,282 |
| Lithuanians | 99.7 /100 | #61 | Exceptional $105,223 |
| Immigrants | Italy | 99.7 /100 | #62 | Exceptional $105,201 |
| Immigrants | Scotland | 99.7 /100 | #63 | Exceptional $105,089 |
| New Zealanders | 99.7 /100 | #64 | Exceptional $105,085 |
| Immigrants | Netherlands | 99.7 /100 | #65 | Exceptional $105,082 |
| Laotians | 99.7 /100 | #66 | Exceptional $104,993 |