Immigrants from Southern Europe vs English Wage/Income Gap
COMPARE
Immigrants from Southern Europe
English
Wage/Income Gap
Wage/Income Gap Comparison
Immigrants from Southern Europe
English
26.4%
WAGE/INCOME GAP
17.3/ 100
METRIC RATING
205th/ 347
METRIC RANK
29.5%
WAGE/INCOME GAP
0.0/ 100
METRIC RATING
336th/ 347
METRIC RANK
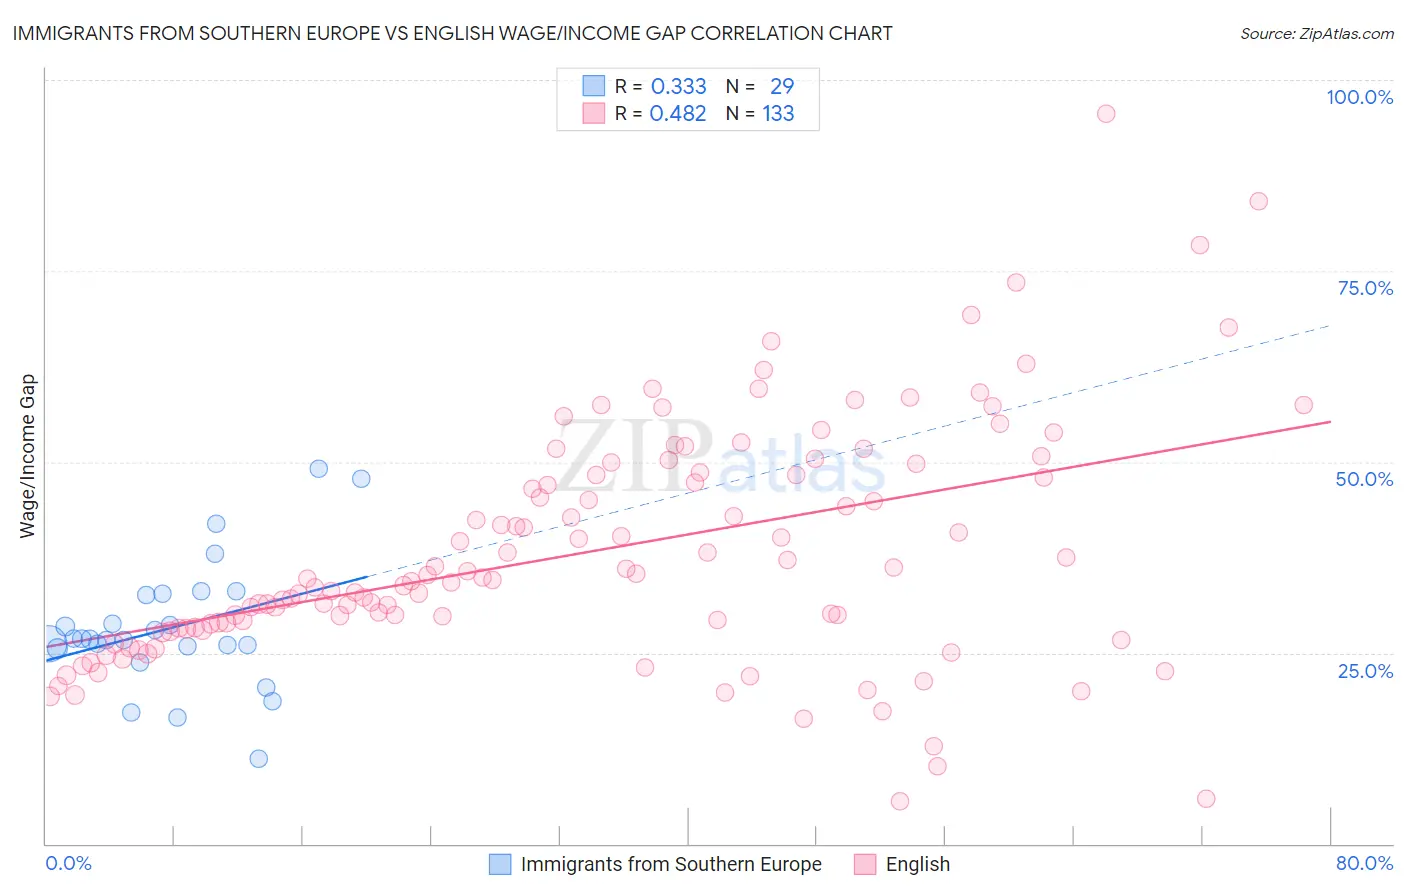
Immigrants from Southern Europe vs English Wage/Income Gap Correlation Chart
The statistical analysis conducted on geographies consisting of 402,480,868 people shows a mild positive correlation between the proportion of Immigrants from Southern Europe and wage/income gap percentage in the United States with a correlation coefficient (R) of 0.333 and weighted average of 26.4%. Similarly, the statistical analysis conducted on geographies consisting of 575,625,723 people shows a moderate positive correlation between the proportion of English and wage/income gap percentage in the United States with a correlation coefficient (R) of 0.482 and weighted average of 29.5%, a difference of 11.5%.
Wage/Income Gap Correlation Summary
| Measurement | Immigrants from Southern Europe | English |
| Minimum | 11.1% | 5.6% |
| Maximum | 49.0% | 95.6% |
| Range | 37.9% | 90.1% |
| Mean | 28.2% | 38.2% |
| Median | 26.8% | 34.6% |
| Interquartile 25% (IQ1) | 25.7% | 28.2% |
| Interquartile 75% (IQ3) | 32.6% | 48.5% |
| Interquartile Range (IQR) | 6.9% | 20.3% |
| Standard Deviation (Sample) | 8.3% | 15.5% |
| Standard Deviation (Population) | 8.2% | 15.4% |
Similar Demographics by Wage/Income Gap
Demographics Similar to Immigrants from Southern Europe by Wage/Income Gap
In terms of wage/income gap, the demographic groups most similar to Immigrants from Southern Europe are Indian (Asian) (26.4%, a difference of 0.090%), Immigrants from Italy (26.5%, a difference of 0.17%), Immigrants from Russia (26.4%, a difference of 0.18%), Laotian (26.4%, a difference of 0.20%), and Immigrants from Eastern Europe (26.4%, a difference of 0.20%).
| Demographics | Rating | Rank | Wage/Income Gap |
| Venezuelans | 21.5 /100 | #198 | Fair 26.3% |
| Dutch West Indians | 21.0 /100 | #199 | Fair 26.3% |
| Delaware | 20.9 /100 | #200 | Fair 26.3% |
| Immigrants | Syria | 19.3 /100 | #201 | Poor 26.4% |
| Laotians | 19.2 /100 | #202 | Poor 26.4% |
| Immigrants | Eastern Europe | 19.2 /100 | #203 | Poor 26.4% |
| Immigrants | Russia | 19.0 /100 | #204 | Poor 26.4% |
| Immigrants | Southern Europe | 17.3 /100 | #205 | Poor 26.4% |
| Indians (Asian) | 16.5 /100 | #206 | Poor 26.4% |
| Immigrants | Italy | 15.8 /100 | #207 | Poor 26.5% |
| Egyptians | 12.7 /100 | #208 | Poor 26.6% |
| Immigrants | Kuwait | 12.6 /100 | #209 | Poor 26.6% |
| Arabs | 12.3 /100 | #210 | Poor 26.6% |
| Mongolians | 11.4 /100 | #211 | Poor 26.6% |
| Iraqis | 11.2 /100 | #212 | Poor 26.6% |
Demographics Similar to English by Wage/Income Gap
In terms of wage/income gap, the demographic groups most similar to English are Immigrants from Taiwan (29.5%, a difference of 0.010%), Swedish (29.4%, a difference of 0.14%), European (29.4%, a difference of 0.28%), Immigrants from South Central Asia (29.3%, a difference of 0.47%), and Dutch (29.6%, a difference of 0.58%).
| Demographics | Rating | Rank | Wage/Income Gap |
| Scottish | 0.0 /100 | #329 | Tragic 29.1% |
| Germans | 0.0 /100 | #330 | Tragic 29.2% |
| Czechs | 0.0 /100 | #331 | Tragic 29.2% |
| Immigrants | South Central Asia | 0.0 /100 | #332 | Tragic 29.3% |
| Europeans | 0.0 /100 | #333 | Tragic 29.4% |
| Swedes | 0.0 /100 | #334 | Tragic 29.4% |
| Immigrants | Taiwan | 0.0 /100 | #335 | Tragic 29.5% |
| English | 0.0 /100 | #336 | Tragic 29.5% |
| Dutch | 0.0 /100 | #337 | Tragic 29.6% |
| Filipinos | 0.0 /100 | #338 | Tragic 29.7% |
| Iranians | 0.0 /100 | #339 | Tragic 29.7% |
| Swiss | 0.0 /100 | #340 | Tragic 30.0% |
| Thais | 0.0 /100 | #341 | Tragic 30.5% |
| Pennsylvania Germans | 0.0 /100 | #342 | Tragic 30.7% |
| Danes | 0.0 /100 | #343 | Tragic 31.0% |