Immigrants from Southern Europe vs Central American Indian Wage/Income Gap

COMPARE

Immigrants from Southern Europe
Race
Ancestry
AfghanAfricanAlaska NativeAlaskan AthabascanAlbanianAleutAlsatianAmericanApacheArabArapahoArgentineanArmenianAssyrian/Chaldean/SyriacAustralianAustrianBahamianBangladeshiBarbadianBasqueBelgianBelizeanBermudanBhutaneseBlackfeetBolivianBrazilianBritishBritish West IndianBulgarianBurmeseCajunCambodianCanadianCape VerdeanCarpatho RusynCelticCentral AmericanCherokeeCheyenneChickasawChileanChineseChippewaChoctawColombianColvilleComancheCosta RicanCreeCreekCroatianCrowCubanCypriotCzechCzechoslovakianDanishDelawareDominicanDutchDutch West IndianEastern EuropeanEcuadorianEgyptianEnglishEstonianEthiopianEuropeanFijianFilipinoFinnishFrenchFrench American IndianFrench CanadianGermanGerman RussianGhanaianGreekGuamanian/ChamorroGuatemalanGuyaneseHaitianHmongHonduranHopiHoumaHungarianIcelanderIndian (Asian)IndonesianInupiatIranianIraqiIrishIroquoisIsraeliItalianJamaicanJapaneseJordanianKenyanKiowaKoreanLaotianLatvianLebaneseLiberianLithuanianLumbeeLuxembourgerMacedonianMalaysianMalteseMarshalleseMenomineeMexicanMexican American IndianMongolianMoroccanNative HawaiianNavajoNepaleseNew ZealanderNicaraguanNigerianNorthern EuropeanNorwegianOkinawanOsageOttawaPaiutePakistaniPalestinianPanamanianParaguayanPennsylvania GermanPeruvianPimaPolishPortuguesePotawatomiPuebloPuerto RicanPuget Sound SalishRomanianRussianSalvadoranSamoanScandinavianScotch-IrishScottishSeminoleSenegaleseSerbianShoshoneSierra LeoneanSiouxSlavicSlovakSloveneSomaliSouth AfricanSouth AmericanSouth American IndianSoviet UnionSpaniardSpanishSpanish AmericanSpanish American IndianSri LankanSubsaharan AfricanSudaneseSwedishSwissSyrianTaiwaneseThaiTlingit-HaidaTohono O'OdhamTonganTrinidadian and TobagonianTsimshianTurkishU.S. Virgin IslanderUgandanUkrainianUruguayanUteVenezuelanVietnameseWelshWest IndianYakamaYaquiYugoslavianYumanYup'ikZimbabwean
Immigration
NonimmigrantsImmigrantsAfghanistanAfricaAlbaniaArgentinaArmeniaAsiaAustraliaAustriaBahamasBangladeshBarbadosBelarusBelgiumBelizeBoliviaBosnia and HerzegovinaBrazilBulgariaBurma/MyanmarCabo VerdeCambodiaCameroonCanadaCaribbeanCentral AmericaChileChinaColombiaCongoCosta RicaCroatiaCubaCzechoslovakiaDenmarkDominicaDominican RepublicEastern AfricaEastern AsiaEastern EuropeEcuadorEgyptEl SalvadorEnglandEritreaEthiopiaEuropeFijiFranceGermanyGhanaGreeceGrenadaGuatemalaGuyanaHaitiHondurasHong KongHungaryIndiaIndonesiaIranIraqIrelandIsraelItalyJamaicaJapanJordanKazakhstanKenyaKoreaKuwaitLaosLatin AmericaLatviaLebanonLiberiaLithuaniaMalaysiaMexicoMicronesiaMiddle AfricaMoldovaMoroccoNepalNetherlandsNicaraguaNigeriaNorth AmericaNorth MacedoniaNorthern AfricaNorthern EuropeNorwayOceaniaPakistanPanamaPeruPhilippinesPolandPortugalRomaniaRussiaSaudi ArabiaScotlandSenegalSerbiaSierra LeoneSingaporeSomaliaSouth AfricaSouth AmericaSouth Central AsiaSouth Eastern AsiaSouthern EuropeSpainSri LankaSt. Vincent and the GrenadinesSudanSwedenSwitzerlandSyriaTaiwanThailandTrinidad and TobagoTurkeyUgandaUkraineUruguayUzbekistanVenezuelaVietnamWest IndiesWestern AfricaWestern AsiaWestern EuropeYemenZaireZimbabweAzores
Central American Indian
Race
Ancestry
AfghanAfricanAlaska NativeAlaskan AthabascanAlbanianAleutAlsatianAmericanApacheArabArapahoArgentineanArmenianAssyrian/Chaldean/SyriacAustralianAustrianBahamianBangladeshiBarbadianBasqueBelgianBelizeanBermudanBhutaneseBlackfeetBolivianBrazilianBritishBritish West IndianBulgarianBurmeseCajunCambodianCanadianCape VerdeanCarpatho RusynCelticCentral AmericanCentral American IndianCherokeeCheyenneChickasawChileanChineseChippewaChoctawColombianColvilleComancheCosta RicanCreeCreekCroatianCrowCubanCypriotCzechCzechoslovakianDanishDelawareDominicanDutchDutch West IndianEastern EuropeanEcuadorianEgyptianEnglishEstonianEthiopianEuropeanFijianFilipinoFinnishFrenchFrench American IndianFrench CanadianGermanGerman RussianGhanaianGreekGuamanian/ChamorroGuatemalanGuyaneseHaitianHmongHonduranHopiHoumaHungarianIcelanderIndian (Asian)IndonesianInupiatIranianIraqiIrishIroquoisIsraeliItalianJamaicanJapaneseJordanianKenyanKiowaKoreanLaotianLatvianLebaneseLiberianLithuanianLumbeeLuxembourgerMacedonianMalaysianMalteseMarshalleseMenomineeMexicanMexican American IndianMongolianMoroccanNative HawaiianNavajoNepaleseNew ZealanderNicaraguanNigerianNorthern EuropeanNorwegianOkinawanOsageOttawaPaiutePakistaniPalestinianPanamanianParaguayanPennsylvania GermanPeruvianPimaPolishPortuguesePotawatomiPuebloPuerto RicanPuget Sound SalishRomanianRussianSalvadoranSamoanScandinavianScotch-IrishScottishSeminoleSenegaleseSerbianShoshoneSierra LeoneanSiouxSlavicSlovakSloveneSomaliSouth AfricanSouth AmericanSouth American IndianSoviet UnionSpaniardSpanishSpanish AmericanSpanish American IndianSri LankanSubsaharan AfricanSudaneseSwedishSwissSyrianTaiwaneseThaiTlingit-HaidaTohono O'OdhamTonganTrinidadian and TobagonianTsimshianTurkishU.S. Virgin IslanderUgandanUkrainianUruguayanUteVenezuelanVietnameseWelshWest IndianYakamaYaquiYugoslavianYumanYup'ikZimbabwean
Immigration
NonimmigrantsImmigrantsAfghanistanAfricaAlbaniaArgentinaArmeniaAsiaAustraliaAustriaBahamasBangladeshBarbadosBelarusBelgiumBelizeBoliviaBosnia and HerzegovinaBrazilBulgariaBurma/MyanmarCabo VerdeCambodiaCameroonCanadaCaribbeanCentral AmericaChileChinaColombiaCongoCosta RicaCroatiaCubaCzechoslovakiaDenmarkDominicaDominican RepublicEastern AfricaEastern AsiaEastern EuropeEcuadorEgyptEl SalvadorEnglandEritreaEthiopiaEuropeFijiFranceGermanyGhanaGreeceGrenadaGuatemalaGuyanaHaitiHondurasHong KongHungaryIndiaIndonesiaIranIraqIrelandIsraelItalyJamaicaJapanJordanKazakhstanKenyaKoreaKuwaitLaosLatin AmericaLatviaLebanonLiberiaLithuaniaMalaysiaMexicoMicronesiaMiddle AfricaMoldovaMoroccoNepalNetherlandsNicaraguaNigeriaNorth AmericaNorth MacedoniaNorthern AfricaNorthern EuropeNorwayOceaniaPakistanPanamaPeruPhilippinesPolandPortugalRomaniaRussiaSaudi ArabiaScotlandSenegalSerbiaSierra LeoneSingaporeSomaliaSouth AfricaSouth AmericaSouth Central AsiaSouth Eastern AsiaSpainSri LankaSt. Vincent and the GrenadinesSudanSwedenSwitzerlandSyriaTaiwanThailandTrinidad and TobagoTurkeyUgandaUkraineUruguayUzbekistanVenezuelaVietnamWest IndiesWestern AfricaWestern AsiaWestern EuropeYemenZaireZimbabweAzores
Wage/Income Gap
Income
Poverty
Unemployment
Labor Participation
Family Structure
Vehicle Availability
Education Level
Disability

Wage/Income Gap Comparison

Immigrants from Southern Europe

Central American Indians

Poor
Exceptional
26.4%
WAGE/INCOME GAP
17.3/ 100
METRIC RATING
205th/ 347
METRIC RANK
22.7%
WAGE/INCOME GAP
99.9/ 100
METRIC RATING
66th/ 347
METRIC RANK

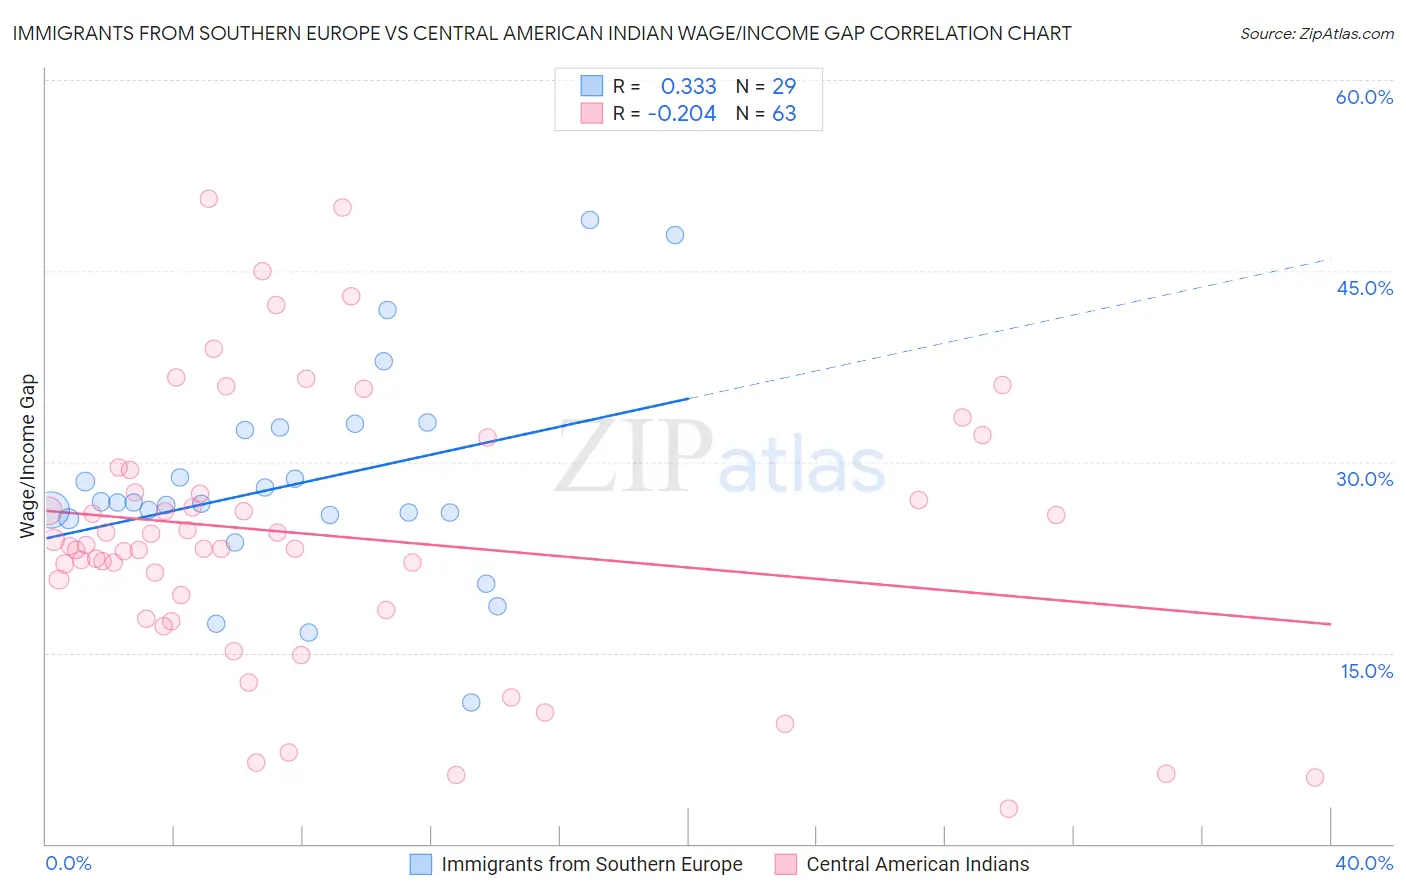
Immigrants from Southern Europe vs Central American Indian Wage/Income Gap Correlation Chart

The statistical analysis conducted on geographies consisting of 402,480,868 people shows a mild positive correlation between the proportion of Immigrants from Southern Europe and wage/income gap percentage in the United States with a correlation coefficient (R) of 0.333 and weighted average of 26.4%. Similarly, the statistical analysis conducted on geographies consisting of 325,982,547 people shows a weak negative correlation between the proportion of Central American Indians and wage/income gap percentage in the United States with a correlation coefficient (R) of -0.204 and weighted average of 22.7%, a difference of 16.5%.
Immigrants from Southern Europe vs Central American Indian Wage/Income Gap

Wage/Income Gap Correlation Summary

MeasurementImmigrants from Southern EuropeCentral American Indian
Minimum11.1%2.8%
Maximum49.0%50.6%
Range37.9%47.9%
Mean28.2%24.2%
Median26.8%23.4%
Interquartile 25% (IQ1)25.7%18.4%
Interquartile 75% (IQ3)32.6%29.3%
Interquartile Range (IQR)6.9%11.0%
Standard Deviation (Sample)8.3%10.6%
Standard Deviation (Population)8.2%10.5%

Similar Demographics by Wage/Income Gap

Demographics Similar to Immigrants from Southern Europe by Wage/Income Gap

In terms of wage/income gap, the demographic groups most similar to Immigrants from Southern Europe are Indian (Asian) (26.4%, a difference of 0.090%), Immigrants from Italy (26.5%, a difference of 0.17%), Immigrants from Russia (26.4%, a difference of 0.18%), Laotian (26.4%, a difference of 0.20%), and Immigrants from Eastern Europe (26.4%, a difference of 0.20%).
DemographicsRating | RankWage/Income Gap
Venezuelans
21.5
/100
|
#198
Fair
26.3%
Dutch West Indians
21.0
/100
|
#199
Fair
26.3%
Delaware
20.9
/100
|
#200
Fair
26.3%
Immigrants | Syria
19.3
/100
|
#201
Poor
26.4%
Laotians
19.2
/100
|
#202
Poor
26.4%
Immigrants | Eastern Europe
19.2
/100
|
#203
Poor
26.4%
Immigrants | Russia
19.0
/100
|
#204
Poor
26.4%
Immigrants | Southern Europe
17.3
/100
|
#205
Poor
26.4%
Indians (Asian)
16.5
/100
|
#206
Poor
26.4%
Immigrants | Italy
15.8
/100
|
#207
Poor
26.5%
Egyptians
12.7
/100
|
#208
Poor
26.6%
Immigrants | Kuwait
12.6
/100
|
#209
Poor
26.6%
Arabs
12.3
/100
|
#210
Poor
26.6%
Mongolians
11.4
/100
|
#211
Poor
26.6%
Iraqis
11.2
/100
|
#212
Poor
26.6%

Demographics Similar to Central American Indians by Wage/Income Gap

In terms of wage/income gap, the demographic groups most similar to Central American Indians are Menominee (22.7%, a difference of 0.17%), Immigrants from Nigeria (22.7%, a difference of 0.18%), Indonesian (22.7%, a difference of 0.21%), Guatemalan (22.6%, a difference of 0.24%), and Immigrants from Uzbekistan (22.7%, a difference of 0.32%).
DemographicsRating | RankWage/Income Gap
Navajo
100.0
/100
|
#59
Exceptional
22.4%
Immigrants | Middle Africa
100.0
/100
|
#60
Exceptional
22.4%
Immigrants | Fiji
100.0
/100
|
#61
Exceptional
22.4%
Immigrants | Guatemala
100.0
/100
|
#62
Exceptional
22.5%
Immigrants | Ecuador
100.0
/100
|
#63
Exceptional
22.5%
Spanish American Indians
100.0
/100
|
#64
Exceptional
22.5%
Guatemalans
99.9
/100
|
#65
Exceptional
22.6%
Central American Indians
99.9
/100
|
#66
Exceptional
22.7%
Menominee
99.9
/100
|
#67
Exceptional
22.7%
Immigrants | Nigeria
99.9
/100
|
#68
Exceptional
22.7%
Indonesians
99.9
/100
|
#69
Exceptional
22.7%
Immigrants | Uzbekistan
99.9
/100
|
#70
Exceptional
22.7%
Immigrants | El Salvador
99.9
/100
|
#71
Exceptional
22.8%
Sub-Saharan Africans
99.9
/100
|
#72
Exceptional
22.8%
Immigrants | Eastern Africa
99.9
/100
|
#73
Exceptional
22.8%