Immigrants from Southern Europe vs English Master's Degree
COMPARE
Immigrants from Southern Europe
English
Master's Degree
Master's Degree Comparison
Immigrants from Southern Europe
English
16.6%
MASTER'S DEGREE
97.2/ 100
METRIC RATING
116th/ 347
METRIC RANK
14.8%
MASTER'S DEGREE
45.0/ 100
METRIC RATING
178th/ 347
METRIC RANK
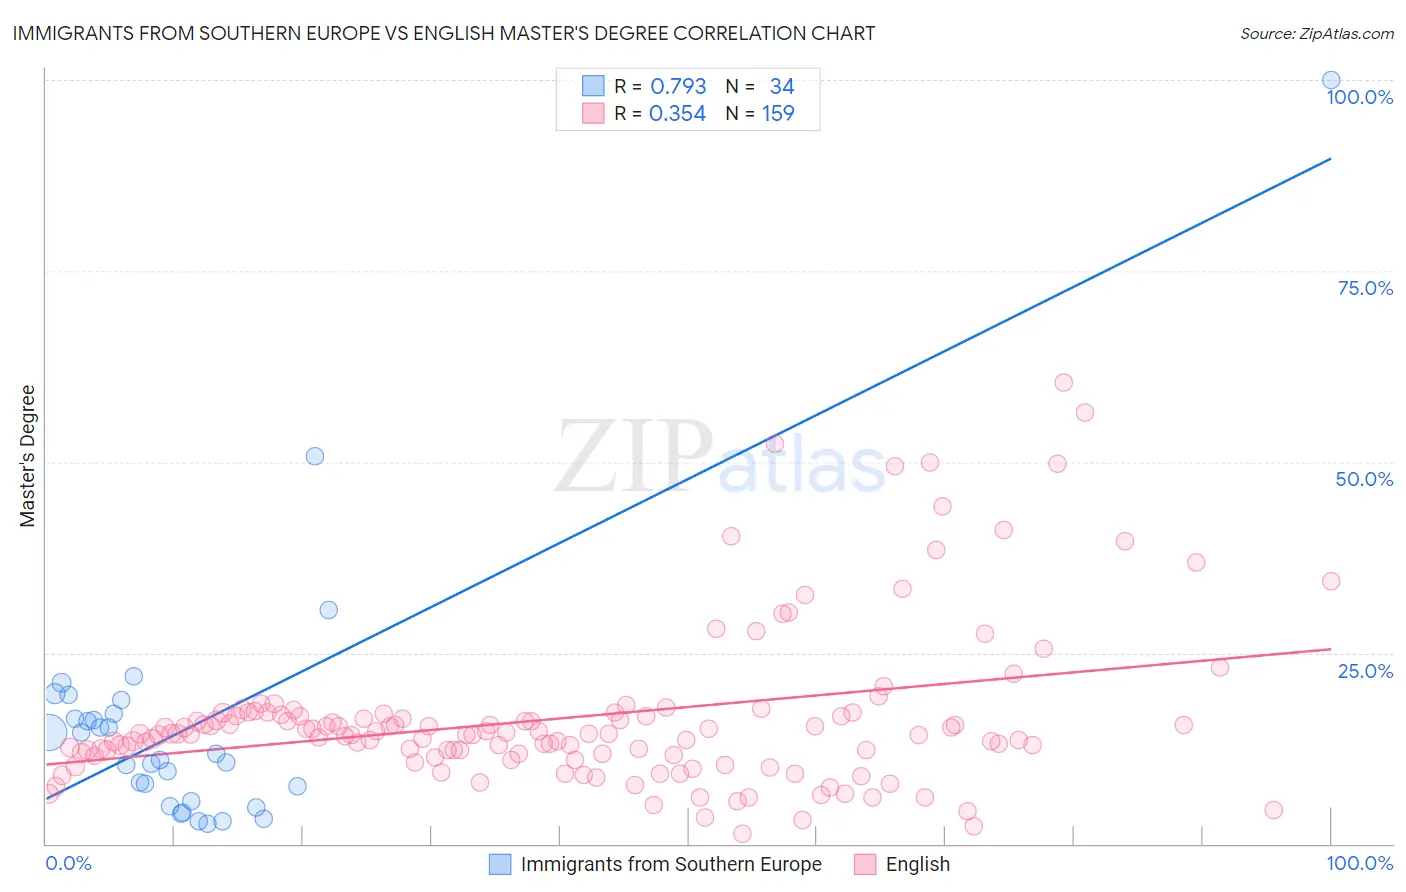
Immigrants from Southern Europe vs English Master's Degree Correlation Chart
The statistical analysis conducted on geographies consisting of 402,732,605 people shows a strong positive correlation between the proportion of Immigrants from Southern Europe and percentage of population with at least master's degree education in the United States with a correlation coefficient (R) of 0.793 and weighted average of 16.6%. Similarly, the statistical analysis conducted on geographies consisting of 578,433,745 people shows a mild positive correlation between the proportion of English and percentage of population with at least master's degree education in the United States with a correlation coefficient (R) of 0.354 and weighted average of 14.8%, a difference of 12.1%.
Master's Degree Correlation Summary
| Measurement | Immigrants from Southern Europe | English |
| Minimum | 2.6% | 1.3% |
| Maximum | 100.0% | 60.3% |
| Range | 97.4% | 59.0% |
| Mean | 15.6% | 16.5% |
| Median | 11.4% | 14.4% |
| Interquartile 25% (IQ1) | 5.6% | 11.7% |
| Interquartile 75% (IQ3) | 17.0% | 16.8% |
| Interquartile Range (IQR) | 11.3% | 5.1% |
| Standard Deviation (Sample) | 17.6% | 10.4% |
| Standard Deviation (Population) | 17.4% | 10.4% |
Similar Demographics by Master's Degree
Demographics Similar to Immigrants from Southern Europe by Master's Degree
In terms of master's degree, the demographic groups most similar to Immigrants from Southern Europe are Immigrants from Moldova (16.6%, a difference of 0.010%), Immigrants from Uganda (16.6%, a difference of 0.12%), Northern European (16.7%, a difference of 0.42%), Brazilian (16.5%, a difference of 0.43%), and Arab (16.7%, a difference of 0.49%).
| Demographics | Rating | Rank | Master's Degree |
| Moroccans | 98.0 /100 | #109 | Exceptional 16.8% |
| Immigrants | Chile | 98.0 /100 | #110 | Exceptional 16.8% |
| Austrians | 97.8 /100 | #111 | Exceptional 16.7% |
| Macedonians | 97.7 /100 | #112 | Exceptional 16.7% |
| Arabs | 97.7 /100 | #113 | Exceptional 16.7% |
| Northern Europeans | 97.6 /100 | #114 | Exceptional 16.7% |
| Immigrants | Uganda | 97.3 /100 | #115 | Exceptional 16.6% |
| Immigrants | Southern Europe | 97.2 /100 | #116 | Exceptional 16.6% |
| Immigrants | Moldova | 97.2 /100 | #117 | Exceptional 16.6% |
| Brazilians | 96.8 /100 | #118 | Exceptional 16.5% |
| Jordanians | 96.5 /100 | #119 | Exceptional 16.5% |
| Lebanese | 96.4 /100 | #120 | Exceptional 16.5% |
| Afghans | 96.2 /100 | #121 | Exceptional 16.5% |
| British | 95.6 /100 | #122 | Exceptional 16.4% |
| Croatians | 95.6 /100 | #123 | Exceptional 16.4% |
Demographics Similar to English by Master's Degree
In terms of master's degree, the demographic groups most similar to English are Immigrants from Colombia (14.9%, a difference of 0.44%), Nigerian (14.9%, a difference of 0.47%), Immigrants from Iraq (14.8%, a difference of 0.48%), Celtic (14.8%, a difference of 0.49%), and Swiss (14.7%, a difference of 0.51%).
| Demographics | Rating | Rank | Master's Degree |
| Immigrants | Ghana | 53.6 /100 | #171 | Average 15.0% |
| Immigrants | Uruguay | 52.8 /100 | #172 | Average 15.0% |
| Costa Ricans | 52.5 /100 | #173 | Average 15.0% |
| Slovaks | 50.0 /100 | #174 | Average 14.9% |
| Immigrants | Peru | 49.6 /100 | #175 | Average 14.9% |
| Nigerians | 48.6 /100 | #176 | Average 14.9% |
| Immigrants | Colombia | 48.3 /100 | #177 | Average 14.9% |
| English | 45.0 /100 | #178 | Average 14.8% |
| Immigrants | Iraq | 41.3 /100 | #179 | Average 14.8% |
| Celtics | 41.3 /100 | #180 | Average 14.8% |
| Swiss | 41.1 /100 | #181 | Average 14.7% |
| Czechs | 40.4 /100 | #182 | Average 14.7% |
| Sri Lankans | 39.6 /100 | #183 | Fair 14.7% |
| Immigrants | Zaire | 39.5 /100 | #184 | Fair 14.7% |
| Barbadians | 38.3 /100 | #185 | Fair 14.7% |