Thai vs Latvian Wage/Income Gap
COMPARE
Thai
Latvian
Wage/Income Gap
Wage/Income Gap Comparison
Thais
Latvians
30.5%
WAGE/INCOME GAP
0.0/ 100
METRIC RATING
341st/ 347
METRIC RANK
27.9%
WAGE/INCOME GAP
0.7/ 100
METRIC RATING
277th/ 347
METRIC RANK
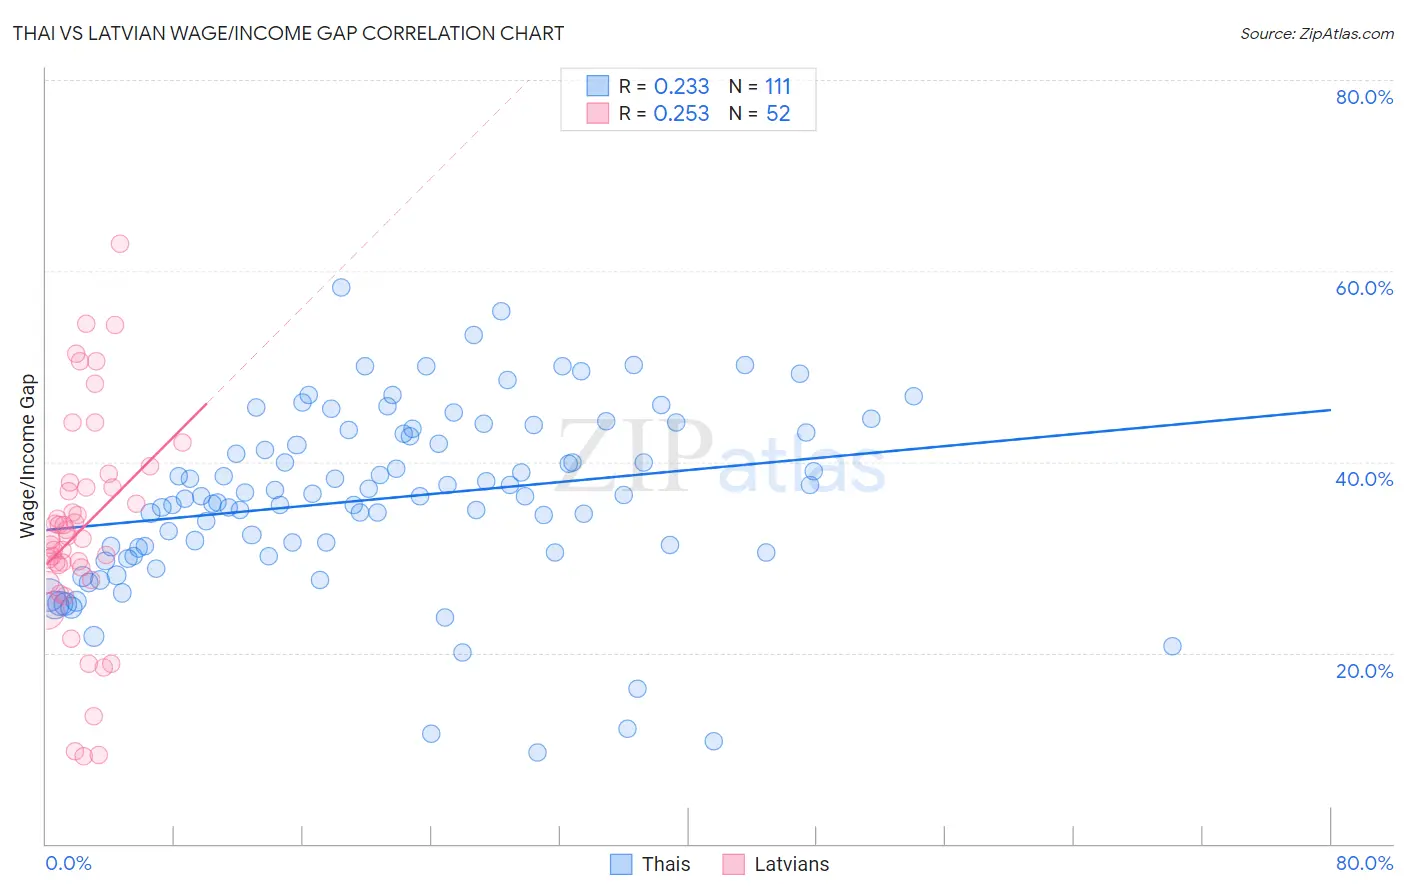
Thai vs Latvian Wage/Income Gap Correlation Chart
The statistical analysis conducted on geographies consisting of 475,429,891 people shows a weak positive correlation between the proportion of Thais and wage/income gap percentage in the United States with a correlation coefficient (R) of 0.233 and weighted average of 30.5%. Similarly, the statistical analysis conducted on geographies consisting of 220,666,647 people shows a weak positive correlation between the proportion of Latvians and wage/income gap percentage in the United States with a correlation coefficient (R) of 0.253 and weighted average of 27.9%, a difference of 9.3%.
Wage/Income Gap Correlation Summary
| Measurement | Thai | Latvian |
| Minimum | 9.5% | 9.2% |
| Maximum | 58.3% | 62.8% |
| Range | 48.7% | 53.6% |
| Mean | 36.2% | 32.9% |
| Median | 36.4% | 32.1% |
| Interquartile 25% (IQ1) | 30.5% | 28.3% |
| Interquartile 75% (IQ3) | 43.1% | 37.6% |
| Interquartile Range (IQR) | 12.6% | 9.3% |
| Standard Deviation (Sample) | 9.4% | 11.4% |
| Standard Deviation (Population) | 9.4% | 11.3% |
Similar Demographics by Wage/Income Gap
Demographics Similar to Thais by Wage/Income Gap
In terms of wage/income gap, the demographic groups most similar to Thais are Pennsylvania German (30.7%, a difference of 0.77%), Danish (31.0%, a difference of 1.6%), Swiss (30.0%, a difference of 1.7%), Assyrian/Chaldean/Syriac (31.0%, a difference of 1.8%), and Iranian (29.7%, a difference of 2.5%).
| Demographics | Rating | Rank | Wage/Income Gap |
| Europeans | 0.0 /100 | #333 | Tragic 29.4% |
| Swedes | 0.0 /100 | #334 | Tragic 29.4% |
| Immigrants | Taiwan | 0.0 /100 | #335 | Tragic 29.5% |
| English | 0.0 /100 | #336 | Tragic 29.5% |
| Dutch | 0.0 /100 | #337 | Tragic 29.6% |
| Filipinos | 0.0 /100 | #338 | Tragic 29.7% |
| Iranians | 0.0 /100 | #339 | Tragic 29.7% |
| Swiss | 0.0 /100 | #340 | Tragic 30.0% |
| Thais | 0.0 /100 | #341 | Tragic 30.5% |
| Pennsylvania Germans | 0.0 /100 | #342 | Tragic 30.7% |
| Danes | 0.0 /100 | #343 | Tragic 31.0% |
| Assyrians/Chaldeans/Syriacs | 0.0 /100 | #344 | Tragic 31.0% |
| Immigrants | India | 0.0 /100 | #345 | Tragic 31.5% |
| Cajuns | 0.0 /100 | #346 | Tragic 33.9% |
| Houma | 0.0 /100 | #347 | Tragic 38.7% |
Demographics Similar to Latvians by Wage/Income Gap
In terms of wage/income gap, the demographic groups most similar to Latvians are Lebanese (27.9%, a difference of 0.0%), Immigrants from Japan (27.9%, a difference of 0.030%), Immigrants from England (27.9%, a difference of 0.080%), American (27.8%, a difference of 0.11%), and Bulgarian (27.8%, a difference of 0.15%).
| Demographics | Rating | Rank | Wage/Income Gap |
| Immigrants | Western Europe | 0.9 /100 | #270 | Tragic 27.8% |
| Ute | 0.8 /100 | #271 | Tragic 27.8% |
| Immigrants | Korea | 0.8 /100 | #272 | Tragic 27.8% |
| Bulgarians | 0.7 /100 | #273 | Tragic 27.8% |
| Americans | 0.7 /100 | #274 | Tragic 27.8% |
| Immigrants | Japan | 0.7 /100 | #275 | Tragic 27.9% |
| Lebanese | 0.7 /100 | #276 | Tragic 27.9% |
| Latvians | 0.7 /100 | #277 | Tragic 27.9% |
| Immigrants | England | 0.6 /100 | #278 | Tragic 27.9% |
| Romanians | 0.5 /100 | #279 | Tragic 28.0% |
| Russians | 0.5 /100 | #280 | Tragic 28.0% |
| Burmese | 0.5 /100 | #281 | Tragic 28.0% |
| South Africans | 0.5 /100 | #282 | Tragic 28.0% |
| French Canadians | 0.4 /100 | #283 | Tragic 28.1% |
| Immigrants | Sweden | 0.4 /100 | #284 | Tragic 28.1% |